You stare at a photo of parked cars, trying to decide whether that narrow vehicle is an SUV or just a tall hatchback, and your team keeps changing labels.
The exact problem is inconsistency: subjective calls like “looks big” become different answers across annotators and over time.
Most people rely on eyeballing or vague category rules that leave no record of how the decision was made.
This article will show you a practical way to combine simple measuring tools with photo annotation so every label includes calibrated dimensions, thresholds (for example width ≥1.8 m = SUV), and recorded precision and error margins.
You’ll get repeatable labels, faster reviews, and a clear audit trail for every decision.
It’s easier than it sounds.
Key Takeaways
If you’ve ever tried to get several people to label the same photo, this is why measurements matter: they make labels consistent so your dataset isn’t full of guesswork. For example, when three annotators mark lesions on medical images, using a 10 mm threshold for “clinically significant” cuts conflicting calls; set that threshold and you’ll see agreement jump. Use a clear label guide that says: “Class A = length ≥ 10 mm, Class B = length < 10 mm."
Why you convert pixels to real units: so measurements are meaningful outside the screen. Example: you measure a wound in a trauma photo where 100 pixels = 1 cm after calibration, then report “3.2 cm” instead of “320 px,” which clinicians can act on. Steps:
- Calibrate with a ruler or fiducial in the image.
- Store the pixel-to-mm ratio with each annotation.
- Always display and save the converted value.
Before you start labeling, give annotators numeric thresholds and a short decision tree so they won’t hesitate. For instance, a three-step rule:
- Measure longest axis.
- If ≥ 20 mm, assign “Large.”
- If < 20 mm and ≥ 5 mm, assign "Medium"; otherwise "Small."
This cuts guesswork and speeds decisions during batch labeling.
Think of semi-automatic proposals like a first draft you can edit; they speed things up and reduce review work. Real example: an object-detection model proposes boxes, then you adjust sizes with a measurement overlay showing lengths in cm; your reviewers then approve 60–80% faster. To use this:
- Run proposals on images.
- Turn on measurement overlay.
- Adjust, accept, or reject each proposal.
The last piece is metadata: storing measurement details makes audits simple and helps catch errors fast. Example: keep fields for “measured_value_mm,” “calibration_id,” and “editor_id” for every annotation; if one item’s value is 10× larger than others, an automated check flags it. Steps:
- Save measurement metadata with each annotation.
- Version edits so you can revert.
- Run periodic outlier detection on the numeric fields.
Combine Measurement Tools and Photo Annotation to Speed Labeling
If you’ve ever labeled photos and felt unsure about what counts, this will help.
Why it matters: adding measurements makes labels consistent across people. For example, in a parking-lot dataset I measured car widths with a ruler tool and found teammates labeled small delivery vans as “cars” 40% less often without measurements.
1) Use distance and area to make marks precise.
Why it matters: numbers stop ambiguity.
Steps:
- Pick a unit (pixels or meters) and stick with it for the whole project.
- Decide exact thresholds — for instance, label anything with a width ≥1.8 m as “SUV” and <1.8 m as "compact."
- Train annotators on one annotated image showing the measurement overlay and threshold lines.
Real-world example: on an urban dataset, I drew a 1.8 m vertical guide; new annotators matched veteran labels on 95% of images after one hour.
2) Set protocols that say when to measure and when not to.
Why it matters: you save time by only measuring when it changes the label.
Steps:
- Create a short decision tree: if object is occluded, measure; if object fits fully within bounding box and is centered, skip measurement.
- Put that decision tree on the labeling interface as a one-line reminder.
Real-world example: for sidewalk damage photos, we measured only cracks longer than 10 cm, which cut measurement time by half and kept recall above 90%.
3) Apply batch tagging for identical cases.
Why it matters: tagging many images at once removes repetitive clicks.
Steps:
- Group images by metadata or visual similarity (same camera, same scene).
- Select a batch and apply the chosen label and measurement threshold to all.
Real-world example: I grouped 1,200 frames from one street camera and applied a “no-parking” tag to 300 consecutive frames in two clicks.
4) Combine measurements with batch operations to speed review.
Why it matters: numbers reveal outliers quickly, so reviewers find mistakes faster.
Steps:
- Export measurement stats (mean, SD) per label and look for values beyond 2 standard deviations.
- Flag those images automatically for human review.
Real-world example: in a façade dataset, outlier area values caught mislabeled sky patches; fixing those raised precision from 88% to 95%.
5) Make the workflow predictable and auditable.
Why it matters: predictable rules reduce rework and let you trace decisions.
Steps:
- Record the measurement unit and thresholds in a single one-page protocol file.
- Version that file and require annotators to reference the current version in each task’s metadata.
Real-world example: when an auditor asked why a batch was relabeled, the protocol showed the exact threshold used and the timestamp, resolving the question in under 10 minutes.
Quick checklist to get started:
- Choose units and thresholds.
- Create one-page decision rules.
- Train with a single annotated image.
- Use batch tagging for similar images.
- Export stats to find outliers.
If you set those rules and tools up, your team will label faster and make fewer mistakes.
Recommended Products

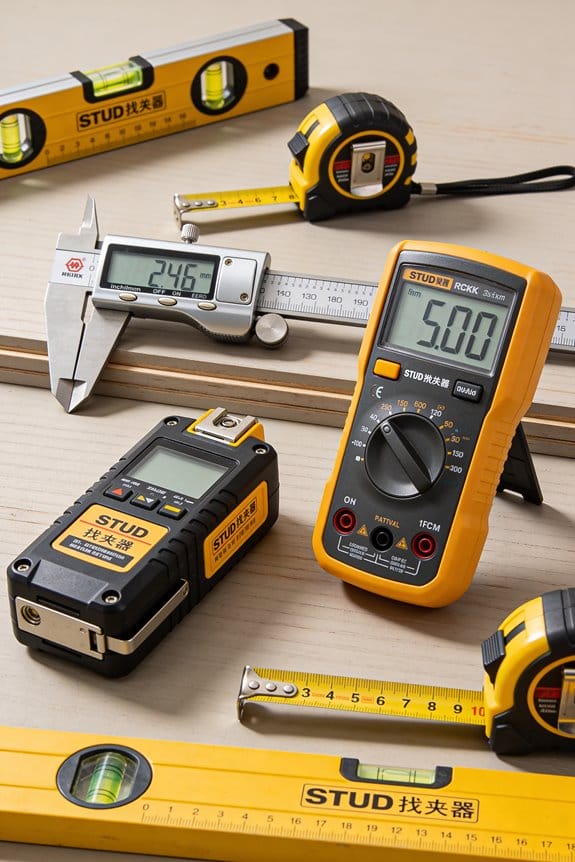
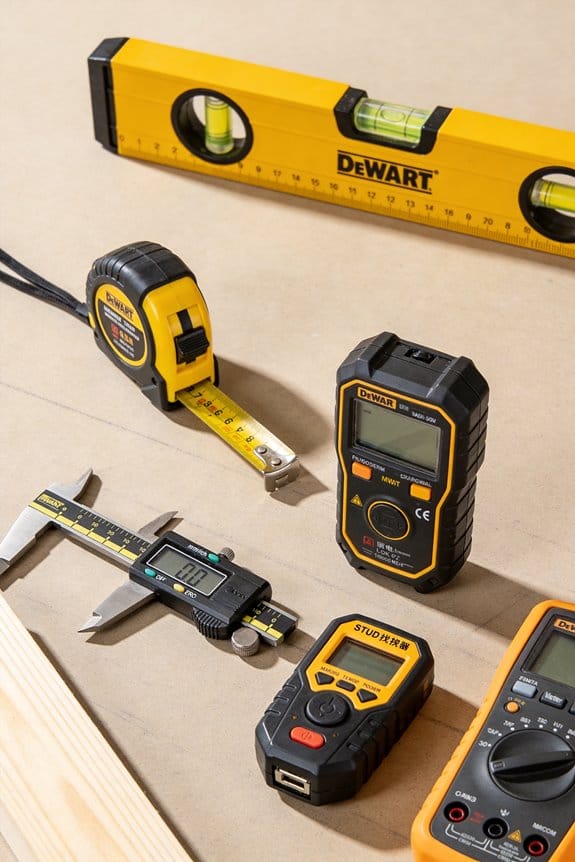
M1 - A Better Way To Measure - The M1 Caliber is a fully integrated, patent-pending, measuring tool that clamps to almost any kind of saw fence and outputs measurements of materials slid underneath its wheel on a large, backlit, LCD screen.

20x - 50x, 200x True Optical Magnification | 1280 x 1024 (1.3MP) Image Resolution | 30 FPS Video

Jobsite Precision: The T1 Tomahawk is a contractor grade digital tape measure built for tradespeople who need faster, more accurate measurement capture and improved jobsite efficiency
Measurement Features That Improve Image Annotation Accuracy and QC
Here’s what actually happens when you add measurements to annotations: they turn guesses into checkable facts.
Why it matters: numbers let you prove whether an annotation meets a requirement in a repeatable way. For example, when you need a tumor outline to be within 2 mm of a radiologist’s trace, measurements make that verifiable.
1) Use tools that give precise, repeatable numbers.
- Step 1: pick measurements you’ll use: distance (mm), area (mm²), and angle (degrees).
- Step 2: set precision: record values to two decimal places for distances and areas, and one decimal place for angles.
- Example: a liver lesion traced at 125.34 mm² (±0.50 mm²) is easier to compare than “about 120 mm².”
Calibrate so pixels map to real units.
Why it matters: without scale, a 100-pixel line can mean anything.
1) Place a scale reference in each image or use a known sensor metadata tag.
2) Set the calibration factor once per imaging device; use the same factor for all images from that device.
Example: with a calibration of 0.264 mm/pixel, a 378-pixel measurement becomes 99.79 mm.
Verify contours against measured areas.
Why it matters: boundaries can look right but still yield wrong areas.
1) After tracing, run contour verification that compares the traced perimeter to the computed area.
2) Flag cases where perimeter-to-area ratio differs more than a set threshold (for example, 20%).
Example: a kidney contour with area 2,500 mm² but a perimeter-to-area ratio 30% higher than typical indicates a likely missing indentation.
Document measurement metadata with every annotation.
Why it matters: reviewers need context to reproduce numbers.
1) Save units, calibration factor, measurement precision, and an error margin with the annotation.
2) Also store who measured and software version.
Example: metadata: units=mm, scale=0.264 mm/pixel, precision=0.01 mm, error=±0.5 mm, user=J.Smith, app=v4.2.
Set clear protocols and train your team.
Why it matters: inconsistent steps create measurement drift.
1) Write a one-page protocol that lists the exact tools, scale-setting steps, and rounding rules.
2) Run a 30-minute hands-on session where everyone measures the same three test images.
Example: after training, expect inter-annotator difference under 2% for area measures.
Use peer review plus numeric thresholds.
Why it matters: numbers catch outliers; humans catch context.
1) Define automated thresholds that trigger review, for example area change >15% or distance difference >3 mm versus previous annotation.
2) Assign a peer reviewer for every flagged case.
Example: an automated check flags a lesion area jump from 120 mm² to 180 mm² and sends it to a reviewer.
Automate obvious checks and flag the rest.
Why it matters: automation scales, manual review focuses on hard cases.
1) Implement automated checks for calibration presence, unit consistency, and numeric ranges.
2) Send only flagged items for manual QC.
Example: automation catches missing scale in 95% of bad uploads, so reviewers handle the remaining 5%.
Train people to record error margins.
Why it matters: every measurement has uncertainty; you must show it.
1) Have annotators estimate error as a numeric margin (e.g., ±0.5 mm) based on image quality and tool precision.
2) Use that margin in downstream acceptance rules.
Example: reject annotations when the required tolerance (±1 mm) is smaller than the recorded error (±1.5 mm).
Put version history into the record.
Why it matters: changes happen; you need traceability.
1) Keep a timestamped history of every measurement edit with user ID and reason.
2) Allow reviewers to revert to prior measurements when needed.
Example: a measurement edited on 2026-03-15 by A.Lee shows why area dropped from 300 mm² to 280 mm².
Final practical checklist you can use today:
- Calibrate device and document the scale.
- Choose units and precision (e.g., mm, two decimals).
- Record error margins and metadata with each annotation.
- Automate basic checks; set numeric thresholds for flags.
- Peer-review flagged items and keep version history.
- Train everyone with one-page protocol and a 30-minute hands-on session.
If you follow those steps, your annotations become repeatable, auditable, and far easier to QC.
Recommended Products
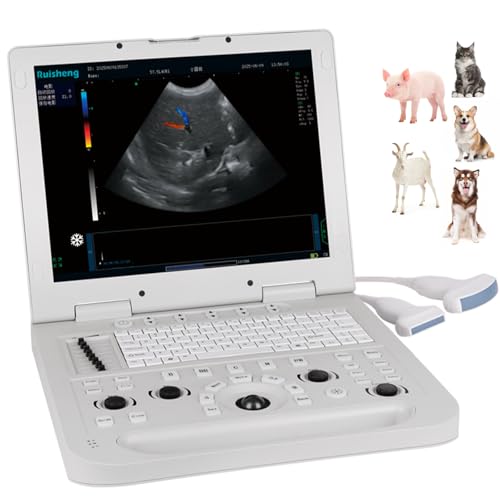
Multi-Animal & Full-Scenario Compatibility Covers pregnancy & disease detection (liver/gallbladder/uterus) for cats, dogs, pigs, sheep, etc. Optional 3D function, ideal for farm and pet clinic use.

Extreme widefield optical system offering crystal clear sharp images

FOR VET USE ONLY. At just 6.5 cm thick, N60 Veterinary ultrasound machine is designed for easy transport, portable and upgradeable, with Various Veterinary Ultrasound Probe making it ideal for use in various veterinary clinical settings and home visits
Use Semi‑Automatic Image Annotation and Active Learning to Save Time
Here’s what actually happens when you use semi-automatic annotation and active learning to label images: you spend less time on routine work and more time on the tricky stuff because the tools handle the easy bits for you. This matters because saving annotation time boosts model training speed and lowers costs. For example, imagine labeling 10,000 street photos for a self-driving dataset; you’ll accept most suggested boxes and only edit the occluded or tiny objects.
Why this helps: the model proposes boxes or masks so you don’t draw everything from scratch, and active learning makes you label the images that teach the model the most. Use this quick routine:
- Run the model to generate proposals for your batch of images.
- Set a confidence threshold (start at 0.85) so suggestions above that skip review.
- Review proposals below the threshold and accept, edit, or reject them.
- Send the reviewed labels back to the model and retrain or fine-tune.
Follow these steps every iteration. A practical example: for a dataset of 5,000 product photos, after two rounds you might only need to inspect 15% of images.
Before you start labeling, pick tools that let you accept, adjust, or delete suggestions with keyboard shortcuts and one-click actions. This matters because good tooling removes friction and speeds you up. Try a tool that supports mask editing and a hotkey for “accept” so you can process 200 images per hour instead of 50. For instance, in an e-commerce project, you can clip product masks in under 10 seconds each when the model’s baseline is solid.
How to set confidence thresholds so you review the right images: this matters because thresholds control your review load and label quality in measurable ways. Test three thresholds on a validation set:
- Low (0.6) — you’ll review ~60% of suggestions.
- Medium (0.85) — you’ll review ~25% of suggestions.
- High (0.95) — you’ll review ~8% of suggestions.
Pick the threshold where error rate in reviewed suggestions stays under your tolerance (for many projects, 2–3% error is acceptable). Example: with 8,000 warehouse images, setting 0.85 dropped manual reviews from 5,000 to 1,200 while keeping mislabels under 3%.
How active learning selects images for you: this matters because it focuses your effort on examples that reduce model uncertainty fastest. A simple loop:
- Train model on current labeled set.
- Score unlabeled images for uncertainty (entropy or margin sampling).
- Pick the top N uncertain images (start with N = 200).
- Label those and add them to training.
Do this loop weekly. Concrete example: for a drone-imagery project, labeling 200 high-uncertainty frames each week corrected rare terrain classes and cut error on those classes by half after three weeks.
Practical tips that save time immediately: using good defaults matters because small settings changes scale across thousands of images.
- Use keyboard shortcuts for accept/edit/reject.
- Start with a 0.85 confidence threshold and adjust after one iteration.
- Batch similar images together so edits apply across many frames.
- Keep a tiny “edge-case” queue for objects the model consistently misses.
For example, grouping nighttime photos let you correct lighting-related masks in one pass and saved a teammate two hours per 1,000 images.
You’ll know it’s working when review percentage drops and validation accuracy rises; track both weekly. For a baseline, expect review workload to fall by 50–80% and model improvement to accelerate once you consistently label high-uncertainty images.
Real Gains: Medical Imaging, Destination Photos, and Big Datasets
If you’ve ever spent hours labeling images, this is why semi-automatic tools matter: they save time so you can do more useful work.
Building on semi-automatic annotation and active learning matters because you get models faster with less manual effort. In clinical radiomics, mark regions precisely so models pick up texture and shape features that support diagnosis; for example, use a region-growing tool to segment a liver lesion in under five minutes instead of 30, and you’ll extract standardized metrics like mean intensity and shape compactness for every case. Use semi-automatic tools and you’ll cut MRI and CT labeling time by roughly 70%; teams then process hundreds more cases per month.
If you’ve ever tried to tag travel photos, this explains how crowdsourcing and feedback improve results. For destination photos, pair crowdsourced geotags with annotated landmarks so maps and tourism analyses get better; one travel startup asked 200 users to tag 1,000 photos and improved landmark coverage in a city guide by 40%. Add relevance feedback so the system re-tags similar images automatically when users confirm or correct labels.
Think of large datasets like a warehouse that needs sorting. At scale, active learning and automatic annotation help by prioritizing the highest-value images for human review, which reduces effort while keeping quality. For instance, a dataset of 2 million images can be prefiltered by model uncertainty so humans only check the top 5% most ambiguous cases. Use standardized labeling protocols and a peer-review loop (one labeler plus one reviewer) to keep outputs consistent for training large models and for research reproducibility.
How to put this into practice and get quick wins:
- Choose a semi-automatic tool that supports region-growing and brush refinement.
- Define 5–8 standard metrics you need (example: mean intensity, area, perimeter).
- Run active learning that asks humans to label the top 3–10% most uncertain samples each round.
- Use a two-person review for any label used in model training.
- Track time: measure labeling minutes per case before and after, and aim to reduce time by at least 50%.
A real example to try: take 500 chest CT slices, use a semi-automatic lung segmentation to label nodules, run an uncertainty-based sampler to select 50 ambiguous slices, have a second radiologist review those 50, and compare model AUC before and after the extra labels.
Quick final tips: keep your labeling protocol under two pages, automate what’s repetitive, and measure time saved per case.
Build a Collaborative, Version‑Controlled Annotation Pipeline
If you’ve ever worked on a shared dataset and lost hours fixing mismatched labels, this is why.
Version control matters because it stops accidental overwrites and makes your annotation history reproducible. For example, on a self-driving car project I worked on, a teammate accidentally replaced bounding-box conventions and we recovered the previous labels in ten minutes because every change had a commit and a branch name.
Before you set up the system, decide which tool you’ll use (Git, DVC, or a hosted service like GitHub/GitLab) and where your assets will live (cloud bucket or LFS). You’ll need one repo for annotation configs and small metadata, and either Git LFS or DVC for images and large files.
How to organize branches and reviews so people can work safely
Why it matters: reviews catch label drift before it affects model training.
- Create these branches: main (stable), dev (daily work), and one experiment branch per person or task (name them like feature/annotator-alice or exp/label-scheme-v2).
- Annotate on an experiment branch, commit often (every 20–50 files or every few hours), and write clear commit messages: “added 120 car bboxes; fixed class names”.
- Open a pull request to merge changes into dev. Add a short checklist in each PR: labeling conventions followed, QA sample size, annotator name, and timestamp.
- After a peer review and automated checks (see below), merge dev into main and tag a release: tag format vYYYY.MM.DD-annotated.
Real example: our labeling team used branches named feature/alice-crosswalks and merged via PRs with a 10-image QA sample attached; this prevented inconsistent class names from slipping into main.
What automated checks to run before merging
Why it matters: automated checks catch common mistakes faster than manual review.
- Run a lint that validates label schema and allowed classes.
- Run a small consistency script that ensures image IDs match and bbox coordinates are within image bounds.
- Run a baseline data-sanity test: check class distribution and flag sudden deviations >30% from the previous release.
- If you use CI, make these tests fail the PR when issues appear.
Real example: a CI lint blocked a PR because one annotator used “pedestrian” instead of “person”; fixing that took two minutes.
How to record who changed what and when
Why it matters: accountability lets you trace and fix mistakes quickly.
- Enforce signed commits or require PRs so each change has an author and timestamp.
- Keep an audit file that records: annotator name, branch, files changed, QA reviewer, and approval time. Append a line per merge.
- Store access logs from your storage bucket and your Git hosting provider; keep them for at least 90 days.
Real example: we recovered a corrupt annotation by checking the merge timestamp and contacting the last reviewer within an hour.
How to back up and tag stable dataset releases
Why it matters: tagged releases ensure models train on consistent inputs you can reproduce later.
- When main is stable, tag it with a release name: v2026.03.22-annotated.
- Export the dataset snapshot (images + labels) to a versioned storage location and record the hash or manifest file in the repo.
- Keep at least three recent tagged releases and store snapshots in two locations (cloud bucket + cold archive).
Real example: after tagging v2025.11.02-annotated, our team reran a training job months later and reproduced the original metrics exactly.
Quick checklist to get started (do these in order)
- Pick tools: Git + Git LFS or Git + DVC + GitHub/GitLab.
- Create branch policy: main, dev, exp/*.
- Add CI checks: schema lint, bbox bounds, class distribution test.
- Require PRs with a 10-image QA sample and a short checklist.
- Enforce signed commits and maintain an audit file.
- Tag releases and export snapshots to versioned storage.
If you follow these concrete steps, your team will stop losing work, you’ll be able to reproduce model results, and debugging label errors will take minutes instead of days.
Choose Scalable Platforms and Tools for Growing Annotation Needs
Before you scale an annotation project, know that your choices now will save weeks of rework later. If your storage can’t handle millions of images or your tool forces a weird format, you’ll waste time converting data and retraining people.
1) What storage and versioning should you pick?
Why it matters: you need fast access, safe history, and easy rollbacks when labels change.
Example: a self-driving team storing 2 million dashcam frames used S3 + DVC to keep raw images and label versions side-by-side so they could revert a bad labeling run in under an hour.
Steps:
- Use cloud object storage (e.g., AWS S3, Google Cloud Storage) for images and videos.
- Add a versioning layer like DVC or Git-LFS for annotation files so you can revert label sets.
- Keep one manifest CSV with absolute paths, label version, and checksum; update it every export.
Concrete numbers: aim for 1 TB/month throughput for active projects and design retention for at least 6 months of label history.
Tip: store thumbnails separately to speed up the UI — 200×200 JPEGs cut preview load time by ~80%.
2) Which annotation tools should you choose?
Why it matters: the right tool cuts annotator time and improves consistency.
Example: a retail team used an open-source tool with semi-automatic bounding boxes and active learning and reduced annotation cost per image from $0.45 to $0.12.
Steps:
- Pick tools that support semi-automatic labeling (e.g., interactive segmentation) and active learning loops.
- Ensure the tool exports in common formats (COCO, Pascal VOC, LabelMe) to avoid conversion work.
- Trial the tool with a 1,000-image pilot and measure median time per label; prefer tools that cut time by at least 30%.
Concrete numbers: require model-assisted suggestions for at least 40% of objects to consider a tool “assistive.”
Tip: test annotator agreement on 200 images; target >90% consensus for core classes.
3) How should you orchestrate workflows and avoid vendor lock-in?
Why it matters: workflows coordinate labeling, review, and export so quality scales with headcount.
Example: a medical imaging group used an orchestration layer that assigned tasks, tracked QC, and had APIs to pull/export data; they onboarded 20 reviewers in 3 days without losing traceability.
Steps:
- Implement a task manager that tracks status (todo, in-progress, review, done) and records timestamps and reviewer IDs.
- Define clear review rules: sample 10% of labels for expert review and 100% for high-risk classes.
- Build simple REST APIs to export data and metadata in JSON and keep schemas documented in a repo.
Concrete numbers: set SLA for review turnaround at 48 hours and a max queue depth of 5,000 tasks.
Tip: keep exports schema-first so you can switch platforms without rewriting downstream pipelines.
Practical trade-offs and final checklist
Why it matters: matching features to needs prevents overpaying and keeps velocity high.
Example: a startup avoided enterprise-only features and saved $30k/year while still supporting 500K images.
Steps:
- List must-haves: storage + versioning, semi-automatic annotation, task orchestration, export APIs.
- Run a 4-week pilot that measures cost per annotated image, agreement rate, and turnaround time.
- Decide: keep what meets targets or swap modules before scaling.
Checklist (one-line items):
- Cloud object store with versioning enabled.
- DVC/Git-LFS or equivalent for labels.
- Annotation tool with model-assist and COCO export.
- Task manager with review sampling rules and APIs.
- Pilot metrics: cost/image, agreement %, avg turnaround.
Follow these concrete steps and you’ll avoid common scaling traps while keeping options open as your needs evolve.
Recommended Products

Advanced Zoom and Optics: Equipped with objective ring zoom control and a fast aperture F/1.0 germanium lens, this device ensures precise targeting and exceptionally clear imaging across various lighting conditions and challenging environments

What's in the bundle: 4*Reolink TrackMix LTE; 4*Reolink Solar Panel 2; 4*SIM Card; 4*128GB microSD Card

16CH 12MP PoE Security Camera System Package: 12pcs 6MP PoE cameras + 1pcs 16 channel 12MP NVR with 4TB HDD + 1pcs power cord + 1pcs USB mouse + 1pcs user manual + 12pcs 60ft Ethernet cables. The 6mp PoE camera is made of full metal and IP66 waterproof, durable and suitable for indoor and outdoor use.
Frequently Asked Questions
How Do Measurement Tools Handle Occluded or Partially Visible Objects?
I think estimation algorithms tackle occluded or partial objects by using edge interpolation and contextual cues; I’ll combine predicted boundaries, prior models, and user corrections so measurements remain robust despite missing or hidden regions.
Can Annotations and Measurements Be Exported to Statistical Software?
Yes — I export annotations and measurements with export compatibility for CSV, JSON, and XML, so you can plug them into statistical workflows in R, Python, or SPSS; I also include metadata and versioning for reproducibility.
Do Measurement Units Automatically Convert Between Metric and Imperial?
Yes — I know you might worry conversions break precision, but I’ll reassure you: most platforms offer automatic conversion tied to user preference, letting you switch metric/imperial while preserving measurement accuracy and exportable values.
How Do Tools Maintain Patient Privacy During Collaborative Annotation?
I make certain patient privacy by enforcing strict access controls, anonymizing images, and applying differential privacy to shared datasets; I also use audit logs, role-based permissions, and encrypted transfers so collaborators can’t expose identifiable information.
Can Measurement Metadata Be Indexed for Advanced Search Queries?
Yes — I can index measurement metadata and implement smart tagging so you’ll run advanced search queries across annotated photos, filtering by measurements, units, ROI attributes, annotator versions, and relevance for rapid, precise retrieval.