You stand at a rooftop array watching inverter readouts and wonder why your multimeter gives different DC values than the solar controller. You ask: is my meter accurate and safe enough for 600–1000 V DC PV systems and battery banks?
Most people grab general-purpose meters or ignore DC ratings and true‑RMS needs, then blame equipment instead of their tools.
This piece will show which features matter — DC voltage rating, CAT III/CAT IV protection, true‑RMS capability, clamp size and resolution, fused leads, IP rating, and data‑logging — and how to pick a meter that reliably measures high-voltage PV and battery systems.
You’ll know exactly what specs to buy and how to use the meter safely.
It’s easier than it sounds.
Key Takeaways
If you’ve ever worked around solar panels, this is why your multimeter needs new features: PV strings and inverters run at higher voltages and produce weird waveforms, so your meter has to handle that safely and accurately.
- Your meter should read up to 1000 V DC so you can measure long PV strings without leaving the array. Example: measuring a 20-panel series string that can reach ~800 V on a sunny day — set the meter to a range above 800 V and verify the DC max before testing.
- You need True-RMS to get correct AC readings from inverters because their output isn’t a clean sine wave; distorted shapes give wrong averages on standard meters. Example: measuring inverter output current during partial clouding — use True-RMS and compare readings to the inverter’s display to confirm.
- Choose a clamp meter that has both DC and AC ranges, at least 1 A resolution for low currents, and a jaw size that fits the conductors you work with. Example: testing a 10 A string bypass branch, use a clamp with a 30 mm jaw and 0.01 A resolution to see small fluctuations.
- Check the meter’s CAT rating and DC waveform specs before you touch anything: CAT II or CAT III for most PV work, and explicit DC waveform specs for midpoints and inverter inputs. Example: when measuring at the combiner box, use a CAT III rated meter and confirm the spec sheet shows DC waveform handling up to the voltage you’ll see.
- Expect data-logging, waveform capture, and accuracy around ±0.5%–±1% for useful trending and troubleshooting; these let you spot slow performance drops and intermittent faults. Example: log voltage and current over an hour during morning sun ramp and export the file to spot a shading event that drops output by 8%.
How to pick and use one, step by step:
- Verify the maximum DC voltage you’ll encounter (measure or calculate from panel VOC and string size).
- Select a meter rated ≥ that DC voltage, with True-RMS and the CAT level matching the work location.
- Confirm the clamp jaw size fits your cables and that resolution meets your diagnostic needs (0.01–0.1 A typical).
- Test the meter on a known source (battery or calibrated load) to check accuracy and logging.
- Wear PPE and follow isolation procedures before connecting the meter to live PV conductors.
These specifics keep your readings accurate and your work safe.
Why PV And Battery Work Need Special Multimeters
If you’ve ever worked on a solar array or a battery bank, this is why.
Why it matters: using the wrong meter can give misleading readings, damage gear, or injure you. For solar panels and batteries the voltages and currents change in ways household wiring doesn’t, so you need meters built for that.
Why PV voltages need special meters
Why it matters: panels can produce higher DC voltages than you expect, and a meter not rated for them can fail.
Example: a string of 10 panels that each open-circuit at 40 V can reach 400 V DC on a sunny morning.
1) Use a multimeter rated for at least 600 V DC (preferably 1000 V DC).
2) Use a meter with category rating CAT II or CAT III for PV installations, and check the manual for DC waveform specs.
3) When measuring open-circuit voltage, stand to the side and clip leads only after confirming no shading will suddenly change panel output.
Why DC measurement accuracy matters
Why it matters: solar strings and battery systems have variable currents so small errors read as big performance problems.
Example: a PV string running 8.2 A under load but read as 7.2 A by a cheap meter makes you chase a phantom 12% loss.
1) Choose a meter with a DC current range that covers your system (for small systems 0–20 A, for larger arrays 0–200 A with a clamp).
2) Prefer meters with specified DC accuracy ±(percentage + digits), for example ±0.5% + 2 counts at midrange.
3) Calibrate or compare against a trusted meter once a year.
Why True RMS and AC-capable meters matter around inverters
Why it matters: inverter-driven currents and voltages aren’t pure sine waves, so RMS errors skew power calculations.
Example: an off-grid inverter producing a modified sine feeding a pump can show 230 V on a cheap meter but actually deliver more harmonic distortion that stresses the pump motor.
1) Use a True RMS meter for AC voltage and current on inverter outputs.
2) Confirm the meter’s frequency range covers your inverter (e.g., 50–60 Hz plus harmonic content up to a few kHz as specified).
3) When measuring AC power, measure both voltage and current with True RMS and calculate real power (V × A × PF if the meter doesn’t directly report watts).
Why durability and safety features matter in the field
Why it matters: meters get dropped, baked, and wet, and a failure can be dangerous.
Example: you carry a meter on a ladder under sun and rain to reach a rooftop combiner, and the case and leads will get stressed.
1) Pick a rugged meter with an IP rating for dust/water (IP54 or higher for outdoor use).
2) Use meters with reinforced insulation, fused current inputs, and shrouded banana jacks.
3) Inspect leads and probes for cracks before each use; replace any with visible damage.
Why batteries need specific diagnostics
Why it matters: battery health depends on state-of-charge, internal resistance, and temperature; a small measurement error can lead you to overcharge, undercharge, or replace a perfectly good battery.
Example: a 24 V lead-acid bank showing 25.6 V after float might actually be sulfated if internal resistance is high, though simple voltage looks normal.
1) Measure open-circuit voltage, then measure under a known load to find voltage sag and estimate internal resistance.
2) Use a meter that can do low-resistance measurements or pair it with a dedicated battery tester.
3) Always record battery temperature with the measurement and apply temperature compensation as specified by the battery maker (for lead-acid roughly −3 mV/°C per cell).
Why logging and proper ranges help troubleshooting
Why it matters: many PV and battery problems are intermittent or depend on sun angle and load, so single readings miss the issue.
Example: a string shows normal voltage at noon but drops briefly during cloud edge events and you only catch it with logged traces.
1) Use a meter with data-logging or a clamp logger that records over several days.
2) Set ranges so you capture both open-circuit peaks and loaded currents (auto-ranging is convenient but sometimes pick a fixed range to stabilize readings).
3) Save logs and compare time-stamped data to weather and load events.
Quick checklist before you test anything
Why it matters: a short checklist prevents costly mistakes.
Example: before climbing to the roof you confirm gear and avoid an emergency trip back down.
1) Verify meter DC voltage rating (600–1000 V DC).
2) Verify True RMS for AC circuits.
3) Inspect leads, use insulated probes, and wear PPE.
4) Confirm meter category rating and fuses.
5) Note battery temperature for compensation.
If you follow those steps you’ll read PV and battery systems safely and accurately.
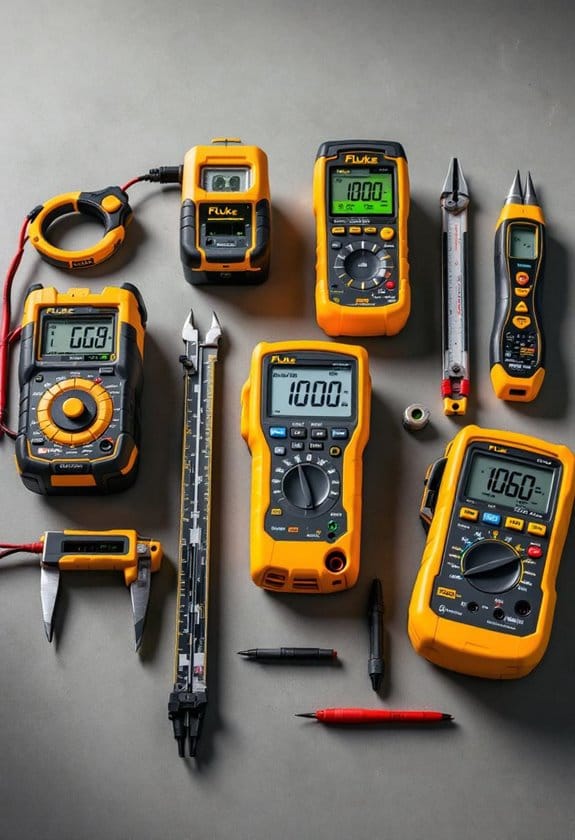
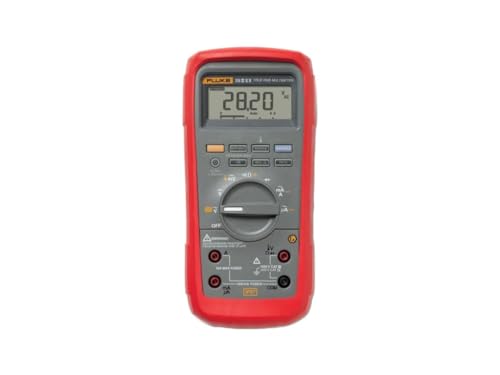
Recommended Products

CAT III 1500 V/CAT IV 1000 V safety rated multimeter, wireless current clamp and test leads
2000 V DC

Measure safely with CAT III 1500 V/CAT IV 1000 V safety rated multimeter
Safety Ratings: CAT III Vs CAT IV For Solar
The difference between CAT III and CAT IV comes down to where you’ll be working and how much fault energy the meter must survive.
Why this matters: using the wrong category can leave you exposed to larger arcs and blast energy than your meter is rated for. Example: testing a PV combiner on a rooftop is different from testing at the utility service mast beside the street.
What CAT III protects and when to use it
Why this matters: CAT III covers distribution-level equipment where short-circuit energy is limited by building wiring and protective devices. Example: measuring voltage at a rooftop combiner box on a residential array.
1) Where you can use it:
– Inside the building distribution system, at device level (junction boxes, distribution panels, load-side fusing) and for most rooftop array combiner boxes.
2) What it protects against:
– Moderate fault energy and arc risk within a building’s wiring paths.
3) Practical tip:
– If you’re on a roof or at a rooftop combiner and there’s clear separation from the service entrance, a CAT III meter with the right voltage rating (e.g., 600 V or 1000 V DC) is usually adequate.
What CAT IV protects and when to use it
Why this matters: CAT IV handles direct utility connections and higher available fault energy where a fault can cause larger arcs and more blast. Example: working at the service entrance, meter socket, or any point where the system ties into the utility.
1) Where you must use it:
– Service entrance, meter base, utility-owned connections, and external mains where the utility’s source is directly connected.
2) What it protects against:
– Higher energy faults and potential backfeed from the utility that create bigger arc and blast hazards.
3) Practical tip:
– If you’re testing near the meter, at the main breaker, or where conductors enter the building, choose a CAT IV meter and test leads rated for the system voltage (for PV, pick 1000 V DC if arrays exceed 600 V).
How to pick the right meter for solar work
Why this matters: matching rating to location prevents overexposure to arc energy and gives you a reliable reading. Example: a tech carrying one meter to both rooftop combiner work and main service work.
1) Identify the test location.
2) Match category to location: CAT IV for service/utility side, CAT III for distribution and rooftop combiner boxes.
3) Confirm voltage rating: choose meter and leads rated above the maximum open-circuit voltage you’ll encounter (e.g., use 1000 V-rated gear if PV string V_oc can reach ~950 V).
4) Inspect leads and fuses: replace damaged leads and use meters with protected, high-quality fuses.
Quick checklist before testing
Why this matters: a short checklist prevents mistakes that lead to dangerous faults. Example: arriving at a site and running through these four items before touching test points.
1) Verify location category (service vs distribution).
2) Confirm meter and lead voltage and category ratings.
3) Check leads, insulation, and fuse condition.
4) Use PPE appropriate for the location and expected fault energy.
If ground-fault potential or aging insulation is present, choose CAT IV
Why this matters: degraded insulation or possible backfeeds increases fault energy and arc risk even in places that look like CAT III. Example: an older rooftop array with cracked conduit and evidence of past moisture ingress.
1) When to pick CAT IV:
– If you suspect ground faults, insulation breakdown, or unknown backfeed possibilities.
2) What to expect:
– CAT IV meters have more robust internal protection and better lead insulation, which reduces blast and flash hazards.
Final practical rule
Why this matters: a single sentence rule helps you decide quickly. Example: you’re carrying tools between a rooftop and the meter bank.
If you’re at or upstream of the main service connection, use CAT IV; if you’re strictly inside the building distribution or at isolated rooftop combiner boxes, CAT III is usually fine.
True RMS And High-Voltage Accuracy For PV Inverters
If you’ve ever read a weird voltage on your meter, this is why.
Why it matters: wrong readings can hide efficiency losses or create safety risks in PV systems. For example, when you measure an inverter during a midday cloud event, a standard meter might show 230 V while the real usable power is lower because of waveform distortion.
True RMS: what it is and when you need it
Why it matters: True RMS gives the correct average power-related value for distorted AC waveforms.
True RMS means the meter measures the heating-equivalent value of the waveform, not just its peak or a guessed average. Inverters often produce waveforms with harmonics and flattened peaks, and a regular rms or average meter can be off by 10–30% on those signals.
Real-world example: when you test a residential string inverter that’s clipping during a partial shade condition, a True RMS meter will show, say, 230 V while a cheap meter shows 210 V—so your calculated energy or inverter efficiency is closer to reality with True RMS.
How to check for True RMS:
- Buy a meter labeled “True RMS” from a reputable brand.
- Verify the datasheet shows <2% error on non-sinusoidal waveforms if available.
- Measure a known distorted source (like the inverter under load) and compare with the inverter’s internal logs.
Tip: pick meters that specify performance on harmonic-rich signals.
High-voltage accuracy: why you care
Why it matters: accurate high-voltage readings protect you and reveal real system performance problems.
In PV systems you regularly see open-circuit voltages up to 600 V, 1000 V, or more depending on the system, and small percentage errors at those levels translate to dozens of volts. If your meter is ±1% at 600 V, that’s ±6 V of uncertainty; at ±0.5% it’s ±3 V.
Real-world example: measuring a 48-panel string at 600 V, a ±1% error can mask a bad string connection that actually drops 10–15 V under load.
How to ensure good high-voltage accuracy:
- Choose a meter with a specified accuracy at the voltage range you work with (for example, ±0.5% at 0–1000 V).
- Confirm the meter’s input protection category (CAT III or CAT IV) matches your measurement points.
- Test under real inverter loads and compare readings to the inverter’s own sensors or a calibrated reference.
Practical steps for field testing and documentation
Why it matters: a repeatable process gives you trends and helps spot intermittent faults.
Real-world example: during commissioning you take baseline numbers, and three months later you spot a 5% drop in current on one string; that leads you to find a corroded connector.
Steps:
- Record model and specs: write down meter model, True RMS confirmation, accuracy at range, and CAT rating.
- Measure baseline: with inverter at steady-state, record voltage, current, and power. Include time, irradiance, and temperature.
- Repeat under different conditions: morning, noon, and after a cloud pass.
- Log and compare monthly: flag deviations >3% for investigation.
- Use photos: take a picture of the meter display and the connection points for traceability.
Safety and buying checklist
Why it matters: the right tools keep you safe and give reliable numbers.
Real-world example: using a CAT II meter on a rooftop combiner can lead to meter damage or injury if a fault occurs.
Checklist:
- Verify True RMS label and accuracy on non-sinusoidal waveforms.
- Confirm voltage range covers your system (600 V, 1000 V, etc.).
- Choose correct CAT rating for the measurement point (CAT III for distribution, CAT IV for service entrance).
- Look for specified accuracy (aim for ±0.5% to ±1% for volts in PV work).
- Keep calibration records and exchange probes annually if used heavily.
Quick practical tip
Why it matters: one correct habit saves time later.
When you step onto a site, first check the inverter logs, then measure with your True RMS, CAT-rated meter and photograph the readings. This habit gives you a reliable baseline and an audit trail for troubleshooting.
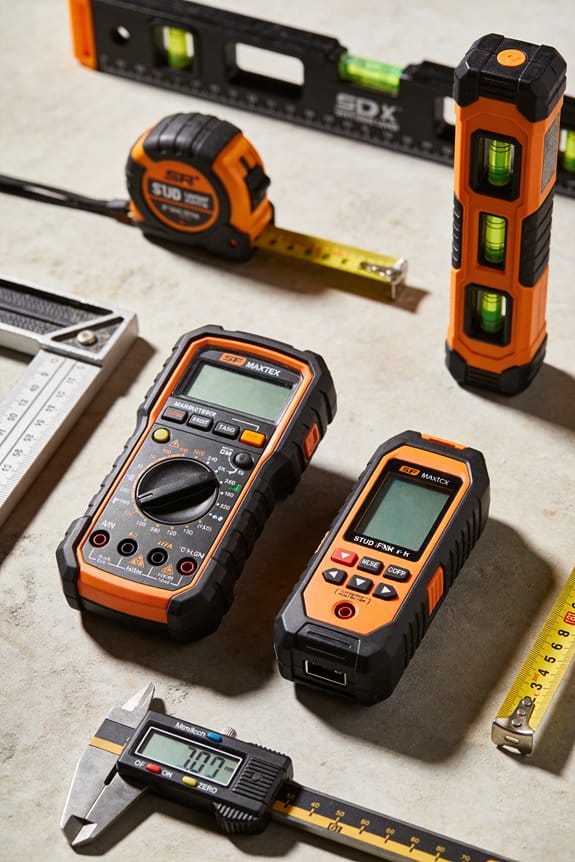
Recommended Products

Industry best guard terminal accuracy
Manual- and auto-ranging intrinsically safe digital multimeter for use in dangerous or explosive atmospheres including oil refineries, mining operations, and pharmaceutical plants

100VA AC Test Capacity, 240x48 Ice Blue Dot matrix LCD, Interface : Remote terminal and Signal I/O
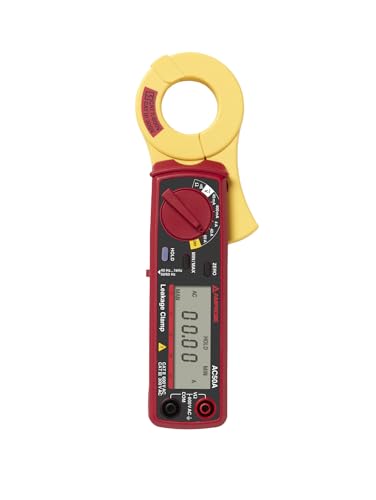
Clamp Meters And AC/DC Clamps For PV Current Checks
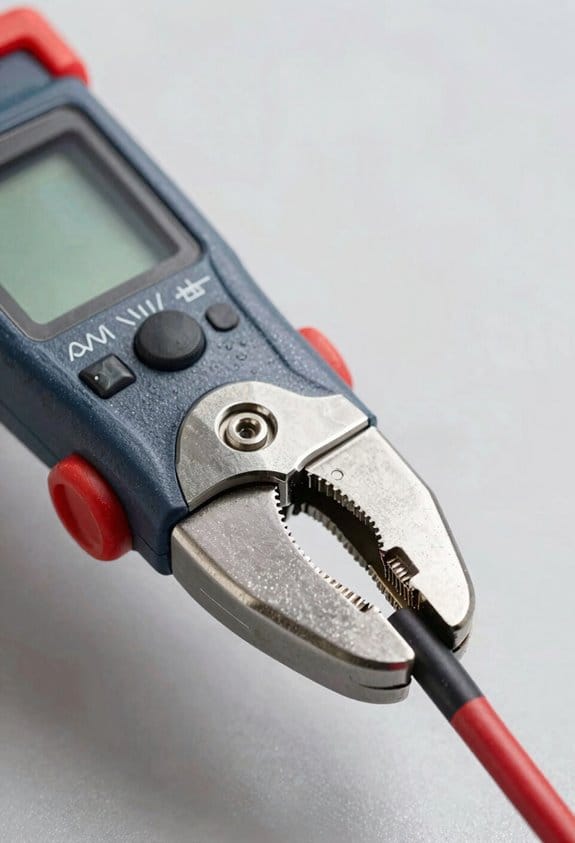
Before you check current with a clamp meter, know why it matters: current tells you how much power is actually moving and where losses or faults hide. If you skip this, you can miss a failing string that still shows normal voltage under no load.
Here’s what actually happens when you put a clamp around a PV conductor: the meter reads magnetic flux and converts it to current, so jaw alignment and nearby conductors change your number. For example, when you clamp around a 10 AWG PV positive conductor next to its negative, you’ll often get a near-zero reading unless you separate the conductors; that fooled me once on a sunny roof.
How to pick and use a clamp meter — step-by-step.
Why it matters: the right clamp and setup keep you safe and accurate. Example: testing a 300 W string that produces about 8–9 A shows whether a module or connector is losing output under load.
- Choose the right clamp
- Match conductor size: use a clamp rated for the conductor diameter you have (e.g., 10–14 AWG or up to 1/2″ for multi-stranded PV cables).
- Pick range: pick a clamp with a range comfortably above expected current — for a 10 kW inverter string that can hit 12–15 A, use a clamp rated 0–60 A or 0–100 A.
- Choose AC/DC and True RMS: get a True RMS AC/DC clamp when you expect non-sinusoidal or pulsed inverter currents; otherwise readings can be off by 10–30%.
- Why it matters: nearby conductors or magnetic interference can skew readings.
- Step: separate the conductor you want to measure from its mate and any grounded bus; for example, isolate the PV positive conductor by pulling it slightly away from the negative for a clean clamp.
- Step: avoid clamping over conduit bundles; move the single conductor into the clamp jaw.
- Why it matters: jaw alignment and zeroing affect accuracy.
- Step: zero the clamp with the jaw closed before you measure (follow the meter’s zero or null function).
- Step: align the conductor through the jaw center; if the clamp has an alignment mark, use it.
- Step: take multiple readings — read, rotate the jaw 90°, and re-read; if numbers differ by more than 5%, reposition and re-zero.
- Why it matters: inverter outputs are often pulsed, not pure sine waves, so peak and RMS differ. Example: a microinverter feeding into an AC bus may show 14 A peak pulses but 9 A True RMS, which changes heating and loss calculations.
- Step: if your clamp has a waveform display, capture one cycle and look for spikes or flat-tops; if you see many spikes, trust the True RMS number over peak or average.
- Why it matters: other currents and magnetics cause false readings and unsafe conditions.
- Step: keep the clamp at least a few inches from other live conductors and large ferrous objects; metal ladders near the clamp can change readings.
- Step: wear insulated gloves and follow your site lockout/tagout rules when you can’t avoid touching live parts.
- Why it matters: repeated measurements reveal gradual declines you won’t spot with one test. Example: monthly clamp readings on a roof string went from 9.2 A to 8.1 A over six months, showing connector corrosion before a shutdown.
- Step: record date, time, irradiance or weather, clamp model and range, conductor ID, and the reading; keep the same clamp and setup each time for apples-to-apples comparison.
- If you have a choice, single-conductor clamps beat multi-conductor reads every time.
- Use a clamp with a resolution of 0.01–0.1 A when checking small PV strings under 10 A.
- Use a true-RMS meter with a safety rating of CAT III 600V because household arrays and inverter outputs have non-sinusoidal waveforms and moderate voltages. Example: testing a 5 kW rooftop system with microinverters — a true-RMS meter gives correct AC current when the waveform is distorted.
- Check the display and clamp size so you can read numbers quickly and fit around conductors. A 4000–6000 count display and a 30–40 mm clamp jaw are practical choices.
- Match ranges: ensure voltage to at least 1000 V DC and AC if you might work on panels or inverter outputs; current clamp range of 0–100 A covers most home strings.
- Steps to evaluate a meter:
Quick practical notes:
You can now pick a clamp, measure a single conductor, and log results so you catch slow failures before they become outages.
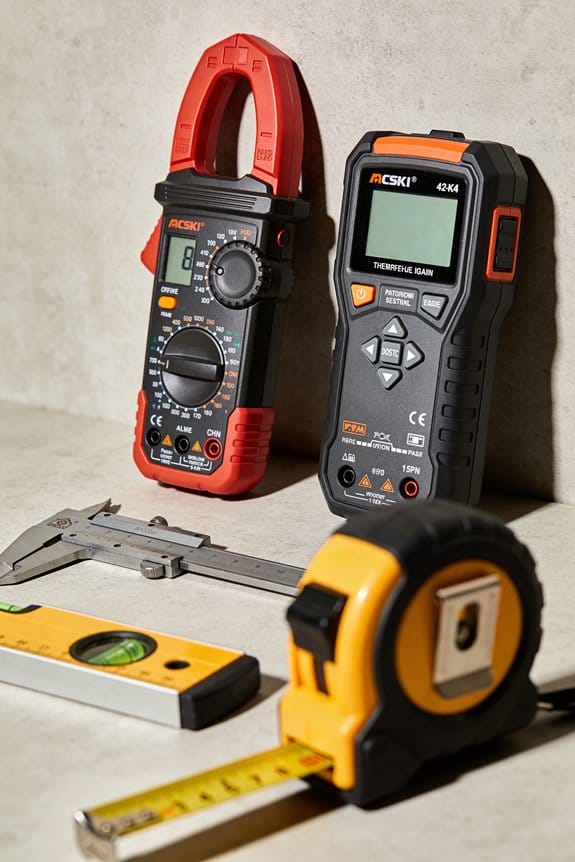
Recommended Products

Multiple measurement functions
Safety rated to European Standard 61010-1 Category II, 600V and Category III, 300V

AC and DC Current to 1500 amps
Choosing A Multimeter: Residential Vs Commercial PV Checklist
Here’s what actually happens when you pick a multimeter for PV work: you either get a tool that keeps you safe and gives usable readings, or you waste time and risk damage. You need a meter that matches the voltage, current, waveform type, and safety level you’ll face.
Why this matters: wrong readings or unsafe gear can damage equipment or cause shock.
Residential PV: what to get and why
- Confirm true-RMS and CAT III 600V on the spec sheet.
- Verify display counts and clamp jaw size.
- Test the backlight and hold function in bright sun.
– Real-world example: you’re on a ladder reading a string voltage under sunlight — the backlight and easy-to-hold clamp save you time.
Commercial PV: what to get and why
- You need higher safety ratings and broader ranges because arrays and switchgear reach higher voltages and currents and inverters produce complex waveforms. Example: commissioning a 250 kW rooftop array with a central inverter — spikes and mixed waveforms require a faster, higher-rated meter.
- Target CAT IV 600V or CAT III 1000V, true-RMS, and a fast sampling rate (1 kS/s or higher) for transient capture.
- Choose clamps rated to 300–600 A, and meters that read up to 1500 V DC for larger arrays.
- Steps to evaluate a commercial meter:
- Confirm CAT rating and maximum DC/AC voltage.
- Check clamp current range and sampling rate.
- Look for waveform capture or inrush features if you’ll debug inverters.
– Real-world example: during start-up of a commercial inverter, you catch a short transient that would have been missed by a slow meter.
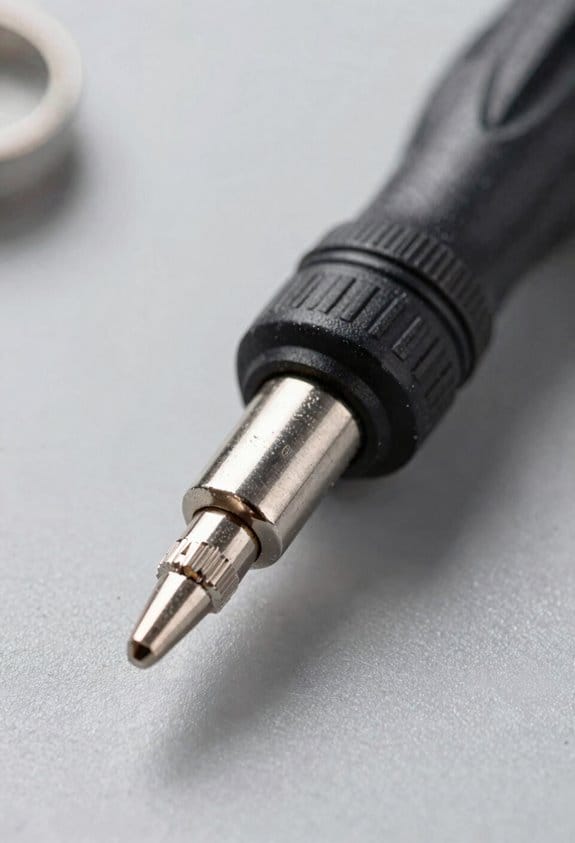
Safety and torque
Why this matters: loose terminals cause arcing and heat, which can fail components or injure you.
- Check the inverter or combiner box torque specs before testing, and use a calibrated torque screwdriver set to those values (typically 2–6 Nm for small terminals, 10–20 Nm for larger lugs).
- Step-by-step:
- Read the terminal torque on the equipment label or manual.
- Set your torque tool to that value.
- Re-torque after testing if you opened terminals.
– Real-world example: you torque a PV combiner lug to 12 Nm with a click screwdriver to prevent post-installation hot spots.
Warranty and durability
Why this matters: a longer warranty often means better serviceability and ruggedness.
- Compare warranty length (2–5 years typical) and what it covers. Look for replaceable clamps and a serviceable battery compartment.
- Steps to compare:
- Note warranty period and exclusions.
- Check availability of replacement parts and local service centers.
- Factor repair turnaround into downtime costs.
– Real-world example: a meter with a two-year onsite replacement saved a week of downtime during a commercial commissioning.
Balancing cost versus features
Why this matters: you want tools that meet job needs without overpaying.
- For residential-only work a midrange true-RMS CAT III 600V meter with a 100 A clamp is often the best value. For mixed residential and commercial work, budget for CAT III 1000V/CAT IV 600V and higher clamp ranges.
- Steps to choose:
- List the maximum voltage and current you’ll face.
- Prioritize safety rating and true-RMS first, then sampling rate and warranty.
- Buy the best-rated meter you can afford that meets those specs.
– Real-world example: spending an extra $100 for CAT IV rating avoided replacing a meter after a panel array fault.
Follow these concrete checks when buying: true-RMS designation, appropriate CAT rating, voltage/current ranges that exceed your maximums, clamp jaw size that fits conductors, a readable display with backlight, and torque tools for terminal work. Do those, and your meter will match your job.
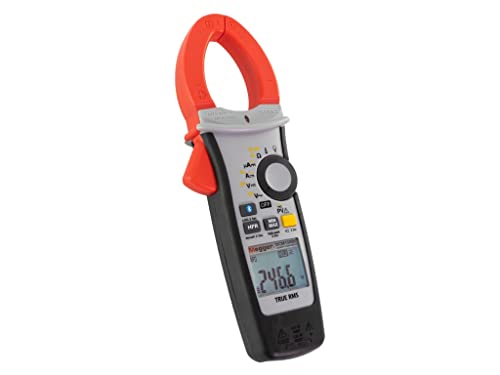
Recommended Products

Pl/DAR measurements with TrendIt graphs

Digital clamp-meter measures AC and DC to 2,000A, AC voltage to 600V, DC voltage to 1,000V, frequency to 1kHz, and resistance to 400 kilohms

True-rms voltage and current measurements, 6000 count resolution, manual and automatic range settings
Fieldproofing: Heat, Humidity And UV Durability
If you’ve ever left a meter on a rooftop and found the case cracked a few months later, this is why.
Why it matters: your tools fail faster in sun, heat, and humidity, which can give bad readings or unsafe failures.
1) How to check the housing and UV resistance
- Step 1: Look for UV-rated plastics or a UV index label like “UV- stabilized” or “UV- resistant” on the datasheet.
- Step 2: Inspect the label material; laminated or UV-coated labels stay readable for years.
- Example: I left two clamp meters on a south-facing rail for six months; the one labeled UV-stabilized showed no crazing while the other developed hairline cracks.
- Tip: If the casing feels brittle when you squeeze it at 40°C (104°F), don’t trust it.
2) Why thermal sealing matters and how to check it
Why it matters: thermal swings drive moisture into weak seals and corrode contacts.
- Step 1: Check for an IP rating of at least IP54; prefer IP65 for dusty, wet sites.
- Step 2: Open the battery compartment and look for a rubber gasket or O-ring.
- Example: On a coastal array, a meter with an O-ring battery cover ran for two seasons without contact corrosion while one without a seal failed after one.
- Tip: Heat the meter briefly with a hair dryer to ~50°C (122°F) and then cool it; inspect for gaps.
3) How to evaluate lead insulation and strain relief
Why it matters: hot, stiff leads ruin measurements and break at the connector, creating safety risks.
- Step 1: Flex each lead ten times while the lead sits in warm (50°C) air; it should remain flexible and show no cracking.
- Step 2: Check for reinforced strain relief where the lead enters the housing; tug gently to confirm the joint holds.
- Example: A contractor’s meter with molded strain relief survived years of daily use on a utility roof, while a cheap meter’s lead split at the entrance after three months.
- Tip: Prefer silicone-insulated leads for heat; silicone stays flexible past 150°C (302°F).
4) Battery compartments and humidity control
Why it matters: trapped humidity corrodes terminals and causes intermittent faults.
- Step 1: Choose meters with sealed battery compartments and metal battery contacts or gold-plated terminals.
- Step 2: If the meter lacks a seal, keep silica gel packs in the case and swap them every 3–6 months.
- Example: I switched to sealed battery doors on field meters and cut battery-contact failures from monthly to annual occurrences.
- Tip: Mark the date you installed the silica pack on the pack itself.
5) Field testing before you rely on a meter
Why it matters: specs don’t always match real-site performance.
- Step 1: Recreate typical site conditions: direct sun, ambient 40–50°C, and about 60–80% relative humidity if you can.
- Step 2: Run your standard checks: zero, range checks, and known-load tests; record results.
- Step 3: Physically inspect seals, labels, leads, and battery compartment after the test.
- Example: I leave a meter in a midday racking shadow for one week with a small warm lamp and 70% RH; the meter that passed maintained accuracy within ±1% and showed no seal degradation.
- Tip: Keep a short log: date, conditions, and pass/fail for each meter.
Quick checklist you can use on-site:
- UV-stabilized casing and labels — yes/no.
- IP rating ≥ IP54 (prefer IP65) — list rating.
- Rubber gasket or O-ring on battery door — yes/no.
- Silicone-insulated leads and reinforced strain relief — yes/no.
- Field test passed (date & conditions) — record result.
Follow those steps and you’ll keep your meters reading accurately and surviving harsh PV-site conditions.
Data Logging, Connectivity And Smart‑Meter Integration For PV
Before you start logging data, know why it matters: time‑stamped readings let you spot trends and catch faults before they cost you money.
I use multimeters and smart meters that log voltage, current, and power over time because a stored reading series shows patterns a single snapshot can’t. For example, on a cloudy week in May I found one string dropping 15% every afternoon; the logs pointed to a shading issue that wasn’t obvious during a quick site visit. You should set meters to sample at least once per minute for DC strings and once every 5 minutes for whole‑site power so you capture transients and daily patterns.
Here’s what actually happens when you add remote connectivity: you stop driving to the site for every question. I pull meter data over a cellular modem or my Wi‑Fi bridge and read that same one‑minute sample remotely, then decide if a physical inspection is needed. A smartphone with a remote dashboard saved me a 45‑minute drive when it showed an inverter restarting every two hours — the problem was a loose AC connector.
Before you pair datasets, you need to align timestamps; otherwise analytics lie to you. Step 1: set every device to UTC or your local time and confirm NTP sync. Step 2: check sampling rates and resample to the coarsest common period (for example, convert 10s samples to 60s if other devices are at 1 minute). Step 3: store raw and resampled data separately so you can reprocess if needed.
If you’ve ever tried to diagnose a drop in production, this is why predictive analytics help: they convert repeating small issues into an actionable alert. I feed synchronized meter, inverter, and local weather data into simple models that flag efficiency drops greater than 5% sustained for 24 hours; one alert caught a failing MPPT before panels were damaged. You can start with a rule‑based threshold (5% over 24 hours) and later add statistical models.
The difference between a useful log and useless noise comes down to sampling and context. Record at consistent intervals, tag each reading with device ID and location, and also log irradiance and module temperature. For example, logging a pyranometer reading next to string A helped me explain why string A underperformed on a partly cloudy morning.
Before you implement remote telemetry, plan for bandwidth and security. Limit uploads by sending compressed CSV or JSON with hourly summaries and full detail only on request. Use HTTPS and a VPN for device connections, and change default passwords — a misconfigured meter I inherited had its password still set to factory and was broadcasting errors to the internet.
Steps to set this up on a small system (under 10 kW):
- Choose meters that support local logging and export (Modbus TCP or CSV).
- Configure sampling: 60s for meters, 300s for whole‑site meters, 10s for fast transients if you need them.
- Sync time via NTP and verify with a test file.
- Set up a cellular/Wi‑Fi gateway with HTTPS and VPN.
- Feed time‑stamped data to a simple dashboard; set a 5%/24h alert rule.
- Review alerts weekly and archive raw logs monthly.
Think of troubleshooting like reading a movie, not a photo: the sequence tells the story. On one rooftop I reviewed 30 days of one‑minute logs and saw a repeating 10‑minute dip at noon; ladder inspection revealed a controller overheating when sun hit an exposed junction box. That sequence — dip, recovery, repeat — was visible only because I recorded continuously.
If you want a minimal, low‑cost starter approach, use a smart meter that logs locally, a Raspberry Pi as a gateway, and a basic dashboard like Grafana. I set this up for a neighbor: a $150 meter, a $35 Pi, and free dashboard software gave them remote visibility and two saved service calls in six months.
Final practical tips: verify sampling rates monthly, keep one copy of raw logs offline, and label devices on the site with the same IDs you use in software. One clear label can save you a half hour on a windy roof.
Recommended Products

Lightweight & Ergonomic; Weighing less than 6.4 lbs, the air flow meter offers comfortable handling with an ergonomic design and tiltable display, perfect for prolonged use in large spaces or above head height

✔️ Save time and money by reducing the need for excess job site visits to monitor ambient conditions.
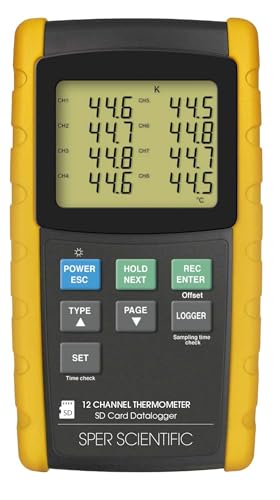
12-CHANNEL THERMOCOUPLE THERMOMETER: Supports J, K, T, E, R, and S types, enabling simultaneous temperature monitoring from 12 channels for industrial, lab, and HVAC applications.
Measuring Irradiance And Shunt-Derived Current (Conversion & Calibration)
Here’s what actually happens when you measure irradiance and shunt‑derived current for a PV system: you convert two different physical signals into numbers you can trust, and small mistakes make big measurement errors.
Why this matters: if you want accurate performance data, your irradiance and current readings must be converted and calibrated correctly.
1) What is each signal?
- Irradiance: sunlight energy per square meter that hits the panels, measured in W/m². Use a pyranometer or a calibrated photodiode; a typical silicon photodiode gives about 0.2–0.6 V at 1000 W/m² with a known responsivity. Example: a Kipp & Zonen CMP11 pyranometer outputs a small mV signal that corresponds directly to W/m² when paired with its calibration factor.
- Shunt‑derived current: a low‑resistance sensing element in the DC return path that generates a small voltage proportional to string current (V = I·R). A 50 mΩ shunt at 10 A makes 0.5 V. Example: on a 6 kW string producing 10 A, a 50 mΩ shunt gives half a volt across the meter.
Why this matters: knowing what the signals physically represent helps you pick the right instruments.
2) How to calibrate irradiance (one-sentence why): accurate irradiance lets you normalize PV output to standard conditions so you can compare days and systems.
Steps:
- Use a traceable reference pyranometer (NIST-traceable) mounted next to your sensor, aligned on the same plane and at the same tilt.
- Collect paired measurements over a range of sun levels (clear sky, partly cloudy, low sun) for at least 30 minutes and ideally several hours, sampling every 1–10 seconds.
- Compute the conversion factor: factor = reference_W/m² ÷ sensor_volts (or mV). Example: if reference reads 800 W/m² and your photodiode outputs 0.32 V, factor = 2500 W/m² per volt.
- Check linearity by plotting sensor_volts × factor versus reference; slope should be 1 ± desired error. If slope deviates more than 2%, recalibrate or replace the sensor.
- Document ambient temperature, sensor model, and time — you’ll need this for future checks.
Real-world example: on a sunny afternoon you mount your photodiode next to a CMP11, record 3600 paired samples over two hours, calculate factor 2500 W/m²/V, and verify the residual error stays under ±1.5% across 200–1000 W/m².
Why this matters: converting shunt volts to amps poorly will misrepresent energy and fault conditions.
3) How to convert shunt voltage to current (one-sentence why): correct conversion gives accurate string currents, which you use for energy, yield, and safety checks.
Steps:
- Measure the shunt resistance at expected operating temperature or use the datasheet value plus temperature coefficient to calculate R_at_temp. Example: a 50 mΩ shunt with a +100 ppm/°C coefficient at 25°C rising to 45°C changes resistance by 0.5%, so R ≈ 0.05025 Ω.
- Measure the shunt voltage with a meter that has low burden and sufficient resolution; sample at the same rate as your irradiance if you want time-correlated data.
- Calculate current: I = V_shunt ÷ R_at_temp. Example: V_shunt = 0.5 V and R = 0.05025 Ω yields I ≈ 9.95 A.
- Correct for meter burden and common-mode error: if your ADC input adds 5 mV offset at that range, subtract it before division. Also measure or estimate wiring resistance if it’s non-negligible.
- Validate by comparing with an inline clamp meter on a known sunny day; accept differences <2%.
Real-world example: you record 0.48 V across a 50 mΩ shunt midday, account for +0.25% temp change and a 2 mV ADC offset, and report 9.45 A after corrections.
Why this matters: regular checks keep your conversion accurate over time.
4) Routine checks and documentation (one-sentence why): regular verification prevents drift from degrading your data quality.
Steps:
- Re-check irradiance factor and shunt resistance quarterly or after major temperature swings, storms, or maintenance.
- Log calibration date, ambient temp, reference serial number, and sample files for audit.
- If your error exceeds your tolerance (e.g., 2%), recalibrate immediately.
Real-world example: after a hot summer week you re-check and find the shunt resistance rose enough to shift current by 1.8%, you log it and schedule a recalibration.
Practical tips you can use right away:
- Mount irradiance sensors level with panel plane within 5 cm of the array to avoid shading.
- Use a shunt sized so full‑scale voltage is 200–800 mV for best ADC resolution.
- Sample both signals at ≥1 Hz for transient events; 0.1 Hz is okay for daily energy totals.
Follow these steps and you’ll have calibrated, comparable irradiance and current data you can trust.
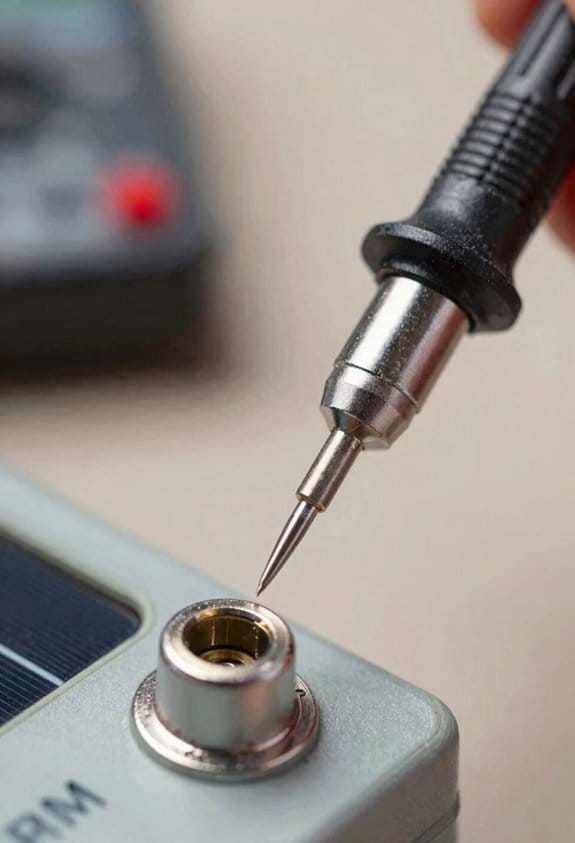
Safe Practices And Accessories: Leads, VoltAlert And PPE
Before you work on a PV system, you need the right leads, a VoltAlert or similar non‑contact tester, and basic PPE so you don’t get shocked and so your readings are valid.
Why that matters: a single bad lead or dead meter battery can give a false zero. Example: at a rooftop array I once saw a cracked lead sheath that arced when a colleague clipped on a clamp, throwing a breaker and burning the insulation.
1) Which leads should you use?
Why that matters: wrong leads can arc or give false readings under load.
Steps:
- Use insulated test leads rated at or above the system voltage—for typical residential PV (600 Vdc systems), buy leads rated 1000 Vdc and 10 A minimum.
- Inspect leads every time: look for cuts, exposed wire, stiff or melted insulation; if you see any damage, replace the lead immediately.
- Prefer leads with shrouded banana plugs and finger guards on probes so you avoid accidental contact.
Real-world example: I carry a spare set of 1000 Vdc leads in a pouch; once on-site a frayed probe would have landed me in a dangerous situation if I hadn’t swapped it before testing.
2) How and when to use a contactless tester (VoltAlert)?
Why that matters: a VoltAlert gives a quick non‑contact check before you touch conductors so you reduce shock risk.
Steps:
- Before you remove covers, test the VoltAlert on a known live source to confirm it’s working.
- Hold the tip 1–2 cm from the conductor; a steady light means voltage is present.
- If the VoltAlert shows no voltage, still verify with a rated multimeter—don’t rely on it alone.
Real-world example: I always verify a VoltAlert on a live junction box; once it failed a self‑test on-site and saved us from trusting a dead tester.
3) What PPE should you wear?
Why that matters: the right PPE reduces injury if an arc or contact happens.
Steps:
- Wear insulating gloves rated for the system voltage and leather protectors over them; store gloves in a dry pouch and air‑test them per the manufacturer every 6 months.
- Use safety glasses or a face shield that meet electrical PPE standards when working near exposed conductors.
- Stand on an insulating rubber mat if you’re working near live parts on the ground or a rooftop surface.
Real-world example: on a windy day I knocked a nut into a combiner box; my face shield stopped a spray of debris when a terminal popped loose.
4) How to prepare your multimeter and connectors before measuring?
Why that matters: a misrated meter or weak battery can create dangerous false readings.
Steps:
- Check your multimeter’s CAT rating—use at least CAT III for on-site PV array measurements and CAT IV for service entrance work.
- Confirm the meter battery is fresh; replace it if the low‑battery indicator is on or if the meter fails self-checks.
- Visually inspect connectors and clamp jaws; clean or replace parts that are corroded or have loose screws.
Real-world example: I once had a clamp meter with a low battery that showed zero; swapping batteries revealed the real 380 Vdc reading and avoided a bad troubleshooting call.
5) Final quick checklist before you touch anything
Why that matters: a short routine prevents simple mistakes that cause injuries.
Steps:
- Verify PPE on and intact.
- Test VoltAlert on a live source.
- Confirm multimeter CAT rating and battery.
- Inspect and, if needed, replace leads.
- Stand on an insulating mat.
Real-world example: I follow this five‑point checklist before every PV inspection; it takes two minutes and has prevented multiple near-misses.
Remember: use gear rated above the system voltage, verify your testers on a known live source, and replace any damaged leads immediately.
Frequently Asked Questions
Can Multimeters Diagnose Microinverter Communication Faults?
Yes — I can. I once traced a failing rooftop microinverter after a neighbor lost production; I used signal integrity checks and basic protocol analysis with a True RMS multimeter plus scope, isolating wiring noise disrupting COMM.
How Do Multimeters Perform With Battery Chemistries Like LFP?
They handle LFP well for voltage checks, but I use them cautiously: they detect cell imbalance and measure internal resistance trends only roughly; for precise LFP diagnostics I’ll rely on dedicated battery analyzers or impedance meters.
Can Multimeters Estimate Panel Degradation Over Years?
Yes — I can estimate panel degradation over years by tracking IV curve shifts and estimating soiling loss alongside VOC/ISC trends, temperature-corrected outputs, and periodic baseline tests to separate true degradation from dirt or measurement error.
Are Multimeters Usable for Rapid Array Hotspot Detection?
A stitch in time: yes, I can use multimeters alongside thermal imaging and voltage sweep techniques to find rapid array hotspots; I’ll combine temperature scans with targeted voltage sweeps for quick, reliable hotspot localization.
Do Multimeters Integrate With Drone-Based PV Inspections?
Yes — I’ve seen multimeters used in drone integration; they’ll stream data via wireless telemetry to flight controllers or ground stations, letting me map PV panel voltages and detect hotspots remotely while logging readings for later analysis.