You just pulled a multimeter probe on an equipment rack and saw odd readings—voltage flickers, unexplained trips, or a waveform that looks “wrong” but you can’t say why. The exact question is: is this distorted power, a transient event, or just a measurement artifact?
Most people assume a simple V/I check is enough or they blame the load without testing for waveform distortion, peaks, or intermittent spikes.
This article will show step-by-step which multimeter features actually reveal true‑RMS values, peaks, crest factor, captured transients, harmonics up to about the 25th order, and precise frequency/duty data, so you can identify distortion, clipping, or intermittent events on site.
You’ll also get quick practical checks and selection tips to decide when a full PQ analyzer is needed. It’s easier than you think.
Key Takeaways
Before you choose a next‑gen multimeter, know why power‑quality capabilities matter: they let you see real problems that simple meters miss. Imagine you’re troubleshooting a factory drive that trips every morning; a meter that captures transients and harmonics will show the exact event that causes the trip.
1) Why measure true‑RMS and high sampling?
- Why it matters: distorted waveforms give wrong readings if you use average-reading meters.
- What to get: meters that sample at high rates (for example, ≥50 kS/s) and report true‑RMS voltage and current.
- Example: a welding machine creates flat‑topped voltage; a true‑RMS reading at 50 kS/s shows the real heating effect, whereas a cheap meter underreports it.

2) What logged values should you collect?
- Why it matters: trends and specific values reveal recurring issues and severity.
- What to get: log RMS, peak, crest factor, and individual harmonics at least up to the 25th harmonic, with timestamps.
- Example: on a commercial building with LED drivers, timestamped harmonic logs can link a specific 5th‑harmonic spike to HVAC startup at 07:00.
3) How to capture short switching events and transients?
- Why it matters: switching events are short but can cause equipment failures if you don’t record them.
- What to get: integrated transient capture with ≥100 kHz bandwidth, pre‑ and post‑trigger buffers, and millisecond or better timestamps.
- Steps:
- Set pre‑trigger to 10 ms and post‑trigger to 50 ms.
- Use ≥100 kHz bandwidth for pulses under 100 µs.
- Save the capture with timestamped markers.
– Example: when an inverter generates 20 µs spikes, a 100 kHz bandwidth capture with pre‑trigger shows the spike’s phase relative to switching.
4) What logging resolution and export formats help audits?
- Why it matters: fine resolution and open exports let you analyze long trends and share data.
- What to get: one‑second or faster logging resolution, frequency resolution of 0.01 Hz, and export to CSV or PQDIF.
- Example: logging at 1 s lets you spot a slow frequency drift from 50.00 Hz to 49.85 Hz over 3 hours; exporting to CSV lets your consultant plot the trend.
5) What phase and compliance measurements are needed?
- Why it matters: phase accuracy and standards metrics let you prove compliance and find root causes.
- What to get: phase angles and phase‑to‑phase/neutral readings to 0.1°, plus IEC power‑quality totals like THD and flicker.
- Example: if two motors run out of sync, a 0.1° phase reading will show a consistent phase shift that points to a wiring or grounding fault.
Quick checklist you can use when buying:
- True‑RMS with ≥50 kS/s sampling.
- Harmonics to the 25th, timestamped.
- Transient capture with ≥100 kHz bandwidth and pre/post triggers.
- Logging at 1 s or faster, 0.01 Hz frequency resolution, CSV/PQDIF export.
- Phase accuracy 0.1° and IEC PQ metrics (THD, flicker).
Use that checklist when you compare models and when you explain needs to procurement.
Quick PQ Checks With a Multimeter
If you’ve ever poked at a multimeter and felt unsure, this will help.

Why this matters: quick checks catch common faults before they blow equipment. Example: at a small bakery I worked with, a 5-minute check found a 55 V sag on one phase that was tripping the mixer every morning.
1) Measure phase‑to‑neutral RMS voltage
Why this matters: RMS tells you the effective voltage your devices see, even if the waveform is ugly. Example: I measured a lighting circuit that read 230 V RMS but looked clipped on an oscilloscope — lights still overheated.
Steps:
- Set your meter to AC RMS (choose true‑RMS if available).
- Probe phase (live) to neutral; hold probes steady and don’t touch the metal tips.
- Record the reading; for a European supply expect about 230 V ±10% (so 207–253 V), for a US single‑phase expect about 120 V ±10% (108–132 V).
Tip: if your meter only shows average, note it may under‑report on distorted waves.
Short check.
2) Check peak voltage to spot flat‑topped waves

Why this matters: peak voltage reveals clipping or waveform limiting that RMS alone can mask. Example: on an air‑compressor feed I saw 350 V peak where 325 V was expected, indicating occasional spikes.
Steps:
- Switch the meter to AC peak or use a scope if you have one.
- Measure phase to neutral and write down the peak value.
- Compare peak to RMS: for a clean sine, peak ≈ RMS × 1.414; a much smaller ratio can mean flat tops.
3) Use correct grounding and stable leads
Why this matters: bad grounding or wobbly leads creates noise and false readings that waste time. Example: using a clipped alligator lead at a factory panel gave fluctuating readings until I used proper shrouded probes.
Steps:
- Use shrouded probes and connect the meter ground to earth if the meter manual recommends it.
- Clamp or tape leads so they don’t move while measuring.
- If you see random jumps, reseat the probe and try again.
4) Prefer true‑RMS meters for non‑sine waveforms
Why this matters: non‑sine waves make average-reading meters lie about voltage values. Example: a variable‑speed drive made the supply waveform nonsinusoidal and an average meter read 10% low while a true‑RMS meter matched the equipment spec.
Steps:
- Check your meter model — if it says true‑RMS, use it for distorted signals.
- If you only have an average meter, note the reading but confirm with a true‑RMS meter or scope when possible.
5) Rough harmonic check using RMS vs peak, or a harmonic‑capable meter
Why this matters: harmonics cause overheating and neutral currents that short‑life equipment. Example: a commercial kitchen had a loud transformer hum; a harmonic scan showed strong 3rd and 5th harmonics causing overheating.
Steps:
- Calculate expected peak from RMS (RMS × 1.414) and compare to measured peak; a mismatch suggests distortion.
- If your meter reports harmonic content, run a harmonic scan and look for dominant odd harmonics (3rd, 5th).
- For a rough rule: if total harmonic distortion (THD) exceeds ~5–8% on sensitive equipment, investigate further.
Final practical tip: write down your measurements with time and location — this makes troubleshooting faster next visit.
Recommended Products
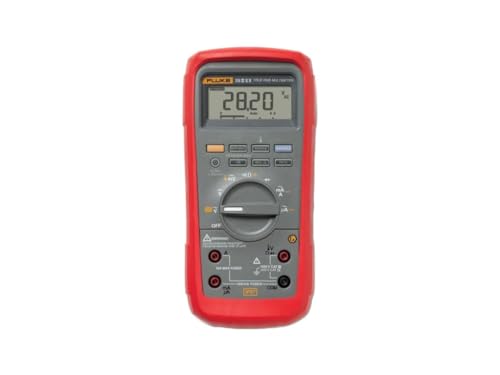
Manual- and auto-ranging intrinsically safe digital multimeter for use in dangerous or explosive atmospheres including oil refineries, mining operations, and pharmaceutical plants

included components: FLUKE-789 AND IR3000FC BUNDLE PACKAGE

Highly Accurate, Quick Responding: Measures AC/DC Voltage and Current, µA Current, Resistance, Temperature, Capacitance, Frequency, and dB/dBm
Why Power‑Quality Checks Matter in Modern Multimeters
Here’s what actually happens when you check power quality with a modern multimeter: you catch problems that otherwise quietly damage equipment. You’ll reduce unexpected failures because distorted waveforms cause overheating and shortened component life, and a meter that shows real‑time voltage and current makes those issues visible.
Why this matters in one sentence: spotting waveform distortion and transients early prevents burned capacitors and motor winding failures. For example, if you watch a compressor motor startup on your multimeter and see voltage drop to 60% for 200 ms, you know that repeated starts will overheat the windings.
How to use your meter to see issues — three clear steps:
- Record a 60‑second real‑time capture of voltage and current at the device while it runs under normal load.
- Check RMS and peak values: RMS should sit within ±5% of nominal; peaks above 1.4× RMS indicate large transients.
- Look at harmonic content or THD if your meter reports it; anything above 5% THD on a motor circuit warrants investigation.
When you monitor continuously, you get trends that guide repairs before things break. One real example: a production line PLC started logging intermittent brownouts; trend data showed a recurring 300 ms sag every night at 2:15 AM, pointing to a scheduled HVAC kick that overlapped with a big load. Fixing the schedule eliminated the sags.
Why RMS and peak checks aren’t enough by themselves in one sentence: they flag symptoms but not the cause. Use these checks with ongoing logging to get actionable alerts and reduce downtime.
Practical checklist for routine power‑quality checks:
- Measure idle and loaded RMS voltage; accept ±5% as normal.
- Capture short transients (100–500 ms) during switching events; note amplitude and duration.
- If available, log THD (total harmonic distortion); treat >5% on power‑electronics loads as suspect.
- Save screenshots or CSVs for trend analysis and correlating with failures.
Real example to visualize a benefit: you record THD of 12% on the line feeding a variable‑speed drive and note repeated inverter trips. Replacing a failing capacitor bank dropped THD to 2% and stopped the trips.
Final practical tip in one sentence: set your meter to trigger on excursions beyond your thresholds (for example, >10% sag, peaks >1.4× RMS, or THD >5%) so you get alerts tied to specific timestamps and conditions.
Must‑Measure PQ Parameters for Next‑Gen Multimeters
If you’ve ever been handed a meter that only shows volts, this is why. You’ll want a next‑gen multimeter that measures specific power‑quality parameters so you can find root causes, not just chase symptoms.
Why this matters: accurate baseline RMS readings tell you whether supply levels are healthy or drifting. Example: on a three‑phase compressor motor circuit, seeing 235 V on phase A, 238 V on phase B, and 212 V on phase C immediately points to an unbalanced supply that explains motor overheating. What to have measured:
- Voltage and current RMS per phase — report values to two decimal places and log at least once per second.
- Phase-to-phase and phase-to-neutral readings — include vector phase angles to 0.1° for power-factor checks.
Why this matters: harmonics change waveform shape and raise equipment temperature, so you need to see which orders are present. Example: in an industrial PLC panel you spot an 11th harmonic at 7% and a 13th at 5%, which explains intermittent relay chatter. What to have measured:
- Individual harmonic amplitudes up to at least the 25th order for voltage and current.
- Harmonic logging with timestamps every minute and a waveform snapshot when a harmonic exceeds a user set threshold.
Why this matters: very short spikes can fry electronics even when RMS looks normal. Example: a UPS input shows normal RMS but a transient spike to 900 V for 3 μs caused a failed server PSU. What to have measured:
- Transient detection with bandwidth ≥100 kHz and a sampling rate that captures microsecond events.
- Capture pre‑ and post‑trigger waveform windows (e.g., 10 ms before and 40 ms after) and timestamp to 1 ms accuracy.
Why this matters: frequency drift and flicker stress motors and lamps, reducing life and causing nuisance trips. Example: a printing press stalled because frequency dipped 0.4 Hz during startup for 12 seconds. What to have measured:
- Continuous frequency measurement with resolution of 0.01 Hz and logging at 1 s intervals.
- Long‑term flicker monitoring (Pst and Plt) with IEC‑compatible averaging and a 10‑minute Pst report and a 2‑hour Plt summary.
Why this matters: IEC totals let you verify compliance and correlate events to standards for audits. Example: after a factory complaint, you used IEC 61000 totals (THD, TIF) with timestamps to show distortion exceeded limits at 14:23 on March 3, matching a production run. What to have measured:
- Per‑IEC total harmonic distortion and totals (THD, TIF, etc.) computed per standard and logged with timestamps.
- Exportable logs in CSV or PQDIF with timezone‑stamped entries so you can match events to maintenance records.
Practical checklist to give a vendor:
- RMS per phase, 0.01 resolution, 1 s logging.
- Harmonics to 25th order, minute‑by‑minute harmonic log.
- Transient capture ≥100 kHz bandwidth, pre/post trigger windows.
- Frequency 0.01 Hz resolution, 1 s logging, Pst/Plt reporting.
- IEC totals and timestamped export in CSV/PQDIF.
If you get a meter that meets those specs, you’ll stop guessing and start fixing.
Recommended Products

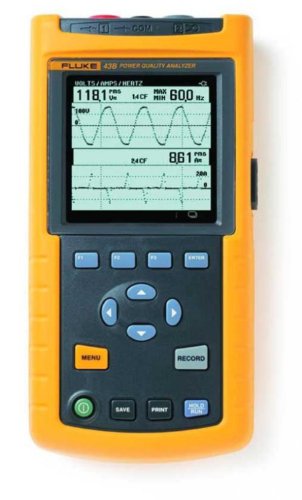
Hand-held dual channel oscilloscope, and recorder

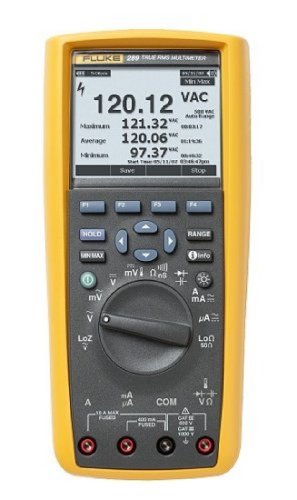
High Precision 60,000-count DMM — ±0.025% basic accuracy on DC voltage for lab-level measurements.

Dual display. True RMS. Basic DC accuracy: 01 percent
Reading TRMS, Peak and Crest Factor to Spot Distortion

If you’ve ever wondered why your power readings don’t match what you feel on a device, this is why.
Why this matters: you want to know if a waveform will overheat equipment or cause nuisance trips. I start by checking TRMS because it tells you the actual heating effect of a waveform even when it’s not a pure sine. For example, on a shop floor with LED lighting and a variable-speed drive, TRMS will show higher watts than a simple AC meter because those non-linear loads create extra heating; measure VTRMS with your meter set to TRMS and note the value in volts RMS.
1) Check TRMS first.
2) Record the RMS voltage (for example, 120.5 V).
3) Compare that to the expected nominal voltage.
Then you compare peak voltage to TRMS to calculate the crest factor; that shows whether peaks are unusually high and can point to clipping or transients. Crest factor = Vpeak ÷ Vrms; if RMS is 120 V and peak measures 180 V, the crest factor is 1.5. A crest factor above about 1.41 on a supposedly clean sine (which equals √2) suggests distortion or short, sharp transients.
Why this matters: unusual peaks can stress insulation or trip protective devices. For instance, if an audio amplifier shows a crest factor of 3.0 during a brief transient, the speakers or caps might fail. Steps to check crest factor:
1) Measure Vpeak with a scope or peak-capable meter.
2) Divide Vpeak by Vrms to get crest factor.
3) Flag values >1.41 for further inspection.
I also look for waveform skew — when the sine is asymmetrical — because skew alters timing and can hide harmonics. Skew is visible on an oscilloscope as the zero crossings shifting left or right relative to the cycle; if one half-cycle is longer or higher than the other, that’s skew. For example, on a single-phase motor supply you might see one half-cycle clipped by 10%, which will add odd harmonics and cause vibration.
Why this matters: skew changes motor torque pulses and can mask harmonic content that would otherwise be caught by a harmonic scan. Quick skew check steps:
1) Capture one cycle on your scope at a known timebase.
2) Measure time between zero crossings on each half-cycle.
3) If mismatched by more than 5%, log it for corrective action.
Together, TRMS, peak, crest factor, and skew let you decide if you need a deeper harmonic scan or targeted fixes on the load. If TRMS is high and crest factor is elevated, schedule a harmonic scan; if skew is present, inspect the load and connections for asymmetry or grounding faults. One clear action: if crest factor >1.5 with repeated transients, install a surge suppressor rated for the measured peak.
Frequency & Duty‑Cycle Checks for Generators and VFDs
If you’ve ever watched a generator or VFD trip unexpectedly, this is why.
Why this matters: frequency and duty cycle tell you whether timing and control signals are stable, and instability can make motors run wrong or damage transformers.
After you check TRMS, peak, and crest factor for waveform distortion, do these concrete frequency and duty‑cycle checks next because they reveal timing issues other measurements miss. For frequency:
- Measure Hz with a true-RMS meter set to frequency, or use a scope with a frequency counter.
- Confirm the generator reads within ±0.1 Hz of nominal when unloaded, and within ±0.5 Hz under the expected operating load range.
- During synchronization, watch phase angle and frequency drift — if frequency differs by more than 0.2 Hz while closing the breaker, abort and correct governor or AVR settings.
Real-world example: on a 60 Hz standby generator feeding a data‑center HVAC transformer, I saw motor vibration start when frequency dipped to 59.4 Hz under a 30% load; correcting governor response held it at 59.95 Hz and solved the vibration.
For duty cycle (PWM and pulse outputs):
- Measure pulse width with a scope or a multimeter that reports duty percentage, probe the VFD gate or output stage directly.
- Expect stable channels to stay within ±2% duty across identical PWM channels; look for a stuck switch if one channel is off by >5%.
- While commissioning, apply three load steps (no load, 50% load, full load) and record duty cycle at each step to watch for timing drift as temperature or current changes.
Real-world example: a conveyor VFD showed one phase at 60% duty while the others were 50% at mid speed; the scope revealed a half‑stuck MOSFET gate that failed when the load increased.
Practical tips you can act on:
- Use the scope for pulses shorter than 1 ms; your meter can miss those.
- Log frequency and duty for at least 5 minutes at each load step to catch slow drift.
- If frequency wanders, check governor, AVR, and fuel/torque control; if duty shifts, inspect gate drivers, heat, and switching semiconductors.
A good multimeter or scope showing stable Hz within ±0.1–0.5 Hz and consistent duty within ±2% helps you avoid premature wear and keeps motors and transformers running reliably.
When to Use a Multimeter vs a Dedicated PQ Analyzer
The difference between a multimeter and a PQ analyzer comes down to what you need to measure.
Why this matters: choose the right tool so you don’t miss a problem or waste money. If you’re checking a home’s outlet for correct voltage and basic health, use a handheld multimeter; if you’re proving compliance to IEC 61000-4-7 or hunting harmonics on an industrial bus, use a dedicated power quality (PQ) analyzer.
Use a multimeter when you need quick, basic checks. It gives voltage, current (with clamp), frequency, peak and RMS values, and duty cycle so you can decide if a system looks healthy. Example: you’re troubleshooting a buzzing lighting circuit in an office—measure line voltage, neutral voltage, and, with a clamp, inrush current on the fixture; seeing 240 V ±3 V and inrush under 5 A usually rules out supply issues. Steps:
- Measure line-to-neutral voltage.
- Measure load current with a clamp.
- Check frequency and RMS values.
- Compute crest factor from peak and RMS if you suspect distortion.
These steps take five minutes for most outages.
Use a PQ analyzer when you need high-resolution spectra, long-term logging, or compliance reports. Why this matters: harmonics and intermittent events often don’t show up on a multimeter. Example: a manufacturing plant has random PLC resets—deploy a PQ analyzer for 24–72 hours on the main feeder to capture harmonic orders up to at least the 50th and log events with timestamps. What to check:
- Enable harmonic analysis to the 50th order or higher.
- Set continuous logging for 24–72 hours.
- Configure event thresholds for voltage sags, swells, and transients.
Those captures let you correlate equipment behavior to grid phenomena.
How to decide which tool to use. Why this matters: picking the wrong instrument wastes time and may miss hazards. Example: you find a motor drawing 40% more current than its nameplate—start with a multimeter clamp for a quick load check, then bring an analyzer if harmonics or transients could be causing overheating. Decision steps:
- Ask what parameter you must prove (instant value vs. spectrum vs. compliance).
- Estimate duration: minutes — multimeter; hours to days — analyzer.
- Consider accuracy and reporting: simple numeric checks — multimeter; certified reports and standards — analyzer.
Practical safety and cost guidance. Why this matters: you keep yourself safe and stay within budget. Example: in a cramped commercial panel, use a CAT III/CAT IV-rated multimeter for live checks; if the issue persists, schedule analyzer deployment when the panel can be isolated for proper current transformer installation. Tips:
- Verify tool safety rating for the environment.
- Budget: a decent multimeter under $200, a basic PQ analyzer starts around $2,000 and goes up.
- Plan a handoff: document multimeter findings (numbers, photos, timestamps) before bringing in the analyzer.
A quick checklist before you start. Why this matters: a small prep saves repeat visits. Example: for a site visit to a small workshop, bring a multimeter, a clamp, spare leads, PPE, and a phone to photograph labels. Checklist:
- PPE and safety-rated meter.
- Clamp or current probes as needed.
- Notes and camera for labeling and timestamps.
Use the multimeter for fast, obvious problems and routine checks; bring in a PQ analyzer when you need spectra, long logs, or standards-grade reports.
Recommended Products

Portable troubleshooting device for analyzing and testing Ethernet networks over copper and fiber optic cable infrastructure
Your unit is calibrated prior to shipment with a new nist-traceable calibration Certificate with data

The Owon HSA1016-TG spectrum analyser has a frequency range of 9 kHz up to 3.6 GHz and a frequency resolution of 1Hz which makes sure that very accurate measurements can be made.
How IEC/ANSI Standards Determine Multimeter PQ Features
Think of standards like a recipe for what your meter has to measure and how accurate it must be.
Why this matters: standards tell you exactly which measurements count for compliance so you don’t buy the wrong tool. For example, if you’re checking a commercial building’s supply and need to show compliance with IEC 61000-4-7 for harmonics, you’ll know whether your meter must resolve individual harmonics up to the 50th and report THD.
Standards define the parameters and limits
- They specify which parameters manufacturers must support (voltage, current, THD, individual harmonics, flicker, crest factor) and the measurement bandwidth like 50 Hz or 60 Hz systems.
- Example: a factory electrician testing motor drives will need harmonic readings up to the 50th harmonic and a crest factor measurement of at least 3:1 when following ANSI C84.1 and IEC 61000 series.
How thresholds and metrics shape features
Why this matters: thresholds determine what counts as acceptable so features must meet them.
1) Harmonic limits — standards set limits per harmonic order and total harmonic distortion (THD).
2) Flicker metrics — IEC 61000-4-15 defines short-term and long-term flicker indices (Pst, Plt) and the meter must compute them over specified time windows.
3) Voltage tolerance bands — standards like ANSI C84.1 and IEC 60038 define acceptable voltage ranges and imbalance limits.
Real-world example: a building maintenance tech measuring flicker for lighting complaints uses a meter that computes Pst over a 10-minute window as required by IEC 61000-4-15.
What this means for meter hardware and software
Why this matters: the standard requirements drive sensor specs and algorithms so you’ll get the measurements you need.
1) Sensors and bandwidth — look for true-RMS inputs, bandwidth to at least the highest harmonic you need (for example, 2.5 kHz for 50th harmonic on a 50 Hz system), and input protection for expected voltages.
2) Sampling and algorithms — instruments must sample fast enough (typically several kS/s per channel) and implement windowing and FFT routines that match standard definitions.
3) Calibration intervals — standards or manufacturers recommend calibration every 1–2 years to keep accuracy within stated limits.
Real-world example: when a utility inspector requires harmonic certification, they reject meters last calibrated more than 24 months ago.
How to pick a meter based on standards
Why this matters: matching meter specs to standards prevents surprises during tests.
Steps:
1) Identify the relevant standards for your application (e.g., IEC 61000-4-7 for harmonics, IEC 61000-4-15 for flicker, ANSI C84.1 for voltage limits).
2) Check that the meter lists compliance or measurement methods tied to those standards.
3) Verify specs: harmonic order capability, THD accuracy, sampling rate, true-RMS, crest factor, and calibration interval.
4) Ask for a calibration certificate and the calibration interval.
Real-world example: before buying for an industrial site you list required harmonic order up to 50, require true-RMS, and demand a current clamp rated for the site’s max current; then you compare three meters against that checklist.
Calibration and traceability
Why this matters: calibration keeps your readings legally and technically defensible.
- Manufacturers typically recommend recalibration every 12–24 months depending on usage; choose a schedule and keep certificates.
- Example: a contractor doing quarterly PQ audits keeps instruments on a 12-month cycle and stores certificates to present with test reports.
If you follow these steps, you’ll choose a multimeter or analyzer that actually meets the measurement and reporting needs set by IEC and ANSI standards.
Practical Test Workflows: From Fast Checks to Full Captures
Before you plan a power-quality test, know why it matters: you want to decide quickly whether a fast field check will save time or if a full capture is needed to diagnose a real problem.
1) How do you decide between a quick check and a detailed capture?
Why it matters: choosing correctly saves hours on site and avoids missing transient events.
Think of the decision like triaging a patient: quick vitals first, then full monitoring if something’s off.
Step 1: Do a 1–2 minute visual and safety check—verify breakers, wiring, and grounding with a flashlight and feel for hot panels. Example: at a small commercial site, you might spot a loose panel cover and a melted wire insulation in under two minutes.
Step 2: Use a multimeter for fast checks: measure RMS voltage (expect within ±5% of nominal), frequency (50.00–50.10 Hz or 60.00–60.10 Hz), and peak-to-peak voltage if needed.
Step 3: Scan for obvious distortion using the meter’s crest factor or a handheld power-quality screener; if crest factor exceeds 1.8 on a sinusoidal source, plan a capture.
If readings are normal and no flicker or noise is noticed, you’re probably done.
2) What exactly do you check with a multimeter during a fast field check?
Why it matters: these quick numbers tell you if something needs a longer recording.
If you’ve ever been called back because a machine tripped overnight, this is why.
Follow these steps:
- Set to AC RMS and measure line-to-line and line-to-neutral voltages; record them. Example: on a 480 V three-phase motor, confirm L-L is 460–484 V.
- Measure frequency and note deviations greater than 0.1 Hz.
- Check peak values or crest factor; if crest factor >1.8, mark for waveform capture.
- Log ambient conditions (temperature, nearby loads).
Finish by writing voltages and frequency on the work order.
3) When should you capture waveforms, and how do you set your recorder?
Why it matters: capturing the right sample at the right rate catches harmonics and transients that meters miss.
Here’s what actually happens when you miss a transient: the machine trips between visits and you have no data.
Step 1: Decide capture duration and sampling rate based on suspected events—use 10 ms resolution (100 kS/s) for fast transients, 1 kS/s for harmonics up to the 50th harmonic on 50 Hz systems. Example: for a PLC-related spike, record at 200 kS/s for 1–5 seconds.
Step 2: Configure channels (voltage and current), set memory depth to at least 10 seconds at chosen rate, and enable pre-trigger if your device supports it.
Step 3: Note the trigger: use voltage threshold for sags/swells, and high-frequency derivative for spikes.
Store raw files with timestamps and a short scene photo.
4) How do you analyze recorded data and report findings?
Why it matters: automated checks save time and point you to the problem quickly.
The difference between guessing and fixing is objective data.
Step 1: Run automated anomaly detection on the file—set it to flag harmonics above 5% of fundamental, transients over 2× peak, and flicker exceeding 0.5% short-term.
Step 2: Review flagged events visually and compute RMS before, during, and after events; attach screenshots of the waveform and a 1-line sketch of the monitored circuit. Example: a factory motor drive showed a 15% 3rd harmonic spike coinciding with conveyor startup.
Step 3: Write a one-page finding: list measured values, time of events, likely cause, and next actions (replace capacitor bank, add surge arrestor, etc.).
Keep raw data for at least 90 days.
Practical wrap-up
Why it matters: following these steps prevents repeat site visits and speeds repairs.
Do the quick checks first, capture when thresholds are exceeded, and document with numbers and images.
You’ll save time and catch the real issues.
Recommended Products

Your unit is calibrated prior to shipment with a new nist-traceable calibration Certificate with data

Your unit is calibrated prior to shipment with a new nist-traceable calibration Certificate with data
Your unit is calibrated prior to shipment with a new nist-traceable calibration Certificate with data
Buying Guide: Choosing a Multimeter for PQ Troubleshooting
If you’ve ever shown up to a job with the wrong tool, this is why.
Power-quality troubleshooting can mean a 2-minute field check or several hours analyzing distorted waveforms, so you should pick a multimeter that matches the problems you expect, the accuracy you need, and the money you’ve budgeted. For example, if you’ll be checking commercial HVAC drives and variable-speed pumps, get a true-RMS meter so readings aren’t off by 10–30% on non-sinusoidal loads. I fixed a downtown office fan motor once with a true-RMS handheld showing 230 V where a basic meter showed 200 V.
Why this matters: wrong readings lead to wrong fixes and repeat visits. Here’s a practical feature map to match to tasks:
1) True‑RMS for non‑sinusoidal loads — choose meters specifying true‑RMS up to at least 5 kHz for variable‑frequency drives.
2) Peak and RMS (or crest factor) when you must check overload risk — look for meters that report both and show crest factor; useful for detecting blown capacitors on UPS systems.
3) Frequency for generator and sync work — pick a meter that reads frequency to 0.01 Hz if you’re synchronizing gensets.
If you’ve ever tried to balance accuracy and budget, this is why.
Think in budget tiers and pick one that fits your work pattern. A concrete breakdown:
1) Basic handhelds ($20–$80): measure voltage, continuity, and resistance; useful for quick checks and safe for general electricians. Example: a $40 unit that reads mains voltage and checks fuses on site.
2) Mid‑range ($100–$300): adds true‑RMS, frequency, and often higher input impedance; good if you test VFDs and commercial lighting. I used a $180 mid‑range meter to verify a rooftop inverter’s output frequency during a storm.
3) High‑end ($400+): measures harmonics, logs transients, and offers wider bandwidth and logging features; necessary for diagnosing recurring flicker or harmonic distortion in office buildings.
Why this matters: picking the wrong tier wastes time or money. When comparing models, check these specs specifically: input impedance (10 MΩ typical for handhelds), measurement bandwidth (at least 5 kHz for distorted waveforms), and stated accuracy (±% of reading).
Before you buy, look at warranty and service plans.
Why this matters: calibration and repair access keep your meter usable and your data defensible. Example: a colleague avoided six weeks of downtime because his unit had a local service center and a 3‑year warranty that included annual calibration.
Steps to finalize a choice:
1) List the three most common tasks you do (e.g., field voltage checks, VFD troubleshooting, harmonic analysis).
2) Match each task to a feature from the feature map above.
3) Pick the lowest budget tier that covers all matched features.
4) Verify specs: true‑RMS, input impedance ≥10 MΩ, bandwidth ≥5 kHz, accuracy in %.
5) Choose a model with at least a 1‑year warranty and accessible calibration service.
A final practical tip: buy a meter with a clear display and hold function if you work alone, and carry a clamp meter too if you do load checks frequently.
Recommended Products

True-rms voltage and current measurements, 6000 count resolution, manual and automatic range settings

Highly Accurate, Quick Responding: Measures AC/DC Voltage and Current, µA Current, Resistance, Temperature, Capacitance, Frequency (electronic & electrical), and Duty Cycle

The 117 multimeter measures AC and DC voltage as well as AC and DC amps. The 323 clamp meter measures AC and DC voltage as well as AC amps
Frequently Asked Questions
How Do Multimeters Detect Fast Transients Under 1 Microsecond?
They capture sub‑1µs transients by using wideband sampling front ends and fast ADCs, often paired with dedicated peak hold circuitry and high‑speed buffers; I’ll trigger, capture, and latch the peak for later readout.
Can Next‑Gen Multimeters Log Synchronized Three‑Phase Harmonic Spectra?
Yes — I can: like gardeners aligning rows, I time align three phases with Phase aware FFT and Inter channel Synchronization, letting me capture Harmonic Phasing so I log synchronized three‑phase harmonic spectra accurately for you.
What Cybersecurity Risks Affect Networked PQ Multimeters?
They’re vulnerable to firmware tampering, unauthorized access and data exfiltration; I’d worry about compromised logs, false harmonics, lateral network pivoting, and denial of service—so I enforce encryption, signed updates, strict auth and network segmentation.
How Do Temperature Variations Influence TRMS Accuracy Over Time?
Temperature variations cause sensor drift that slowly skews my TRMS accuracy; I rely on thermal compensation to correct changes, but prolonged extremes still induce calibration shifts, so I recommend periodic recalibration and monitoring to maintain precision.
Are Calibration Intervals for PQ Functions Different From Standard Measurements?
Like a compass losing its true north, I say yes: PQ functions often need tighter calibration intervals due to greater calibration drift and higher measurement uncertainty, so I schedule more frequent checks than for standard multimeter measurements.