You just handed an energy savings report to a regulator and they asked for meter-level logged data — now what exact files and evidence do they expect? You know your estimates and invoices, but you don’t have timestamped meter readings or calibration records to back up your claims.
Most teams try to patch together spreadsheets or rely on post-hoc estimates, which fails audits and risks fines. This article will show you which meters and loggers to use, what raw CSVs and calibration records to collect, and how to organize them so you produce a legally defensible baseline and verifiable post‑change proof.
You’ll learn how to normalize for weather and occupancy and reconcile bills so savings stand up to scrutiny. It’s easier than it sounds.
Key Takeaways
If you’ve ever had to prove savings to a regulator, this is why.
Regulators now require meter‑based savings numbers, so you need measurement tools that produce legally defensible data. For example, install a calibrated meter on a building’s main feed and log interval data every 15 minutes; that log becomes evidence you can present to an auditor.
Before you run an audit, you need to know how to reduce risk.
Logged interval data plus a documented chain of evidence shows baseline-to-post changes and helps you avoid fines. Example: keep a dated file with meter serial numbers, installation photos, and checksumed CSVs so you can prove the data hasn’t been altered.
Think of continuous monitoring like a security camera for performance.
Continuous sensors and federated monitoring give you verifiable time‑series proof that measures are still saving energy months later. A grocery store that keeps HVAC and refrigeration meters streaming to an EMIS dashboard can show hourly savings during a heat wave, not just monthly bill drops.
The difference between guesswork and credible claims comes down to measurement quality.
Use calibrated, high‑accuracy meters and document chain‑of‑custody to shrink uncertainty and improve incentive payments. For instance, choose Class 0.5 meters for billing‑grade accuracy, record calibration certificates, and log who handled each device.
If you want numbers that match reality, normalize the data.
Data‑driven models and an Energy Management Information System (EMIS) let you adjust for weather and occupancy, reconcile meter readings with utility bills, and quantify true savings. Example steps: 1) Collect weather and calendar data. 2) Build a regression model. 3) Compare predicted baseline to actual post‑retrofit consumption.
Why New Regulations Force Measurement Tools for Energy Audits
If you’ve ever had to prove savings to a regulator, this is why.

Why it matters: regulators now check exact numbers, not guesses. For example, a factory I audited was fined after its owner relied on rough estimates instead of meter data; replacing estimates with logged readings avoided a repeat fine.
1) What measurement tools do for your audit
Why it matters: tools give you legally defensible numbers.
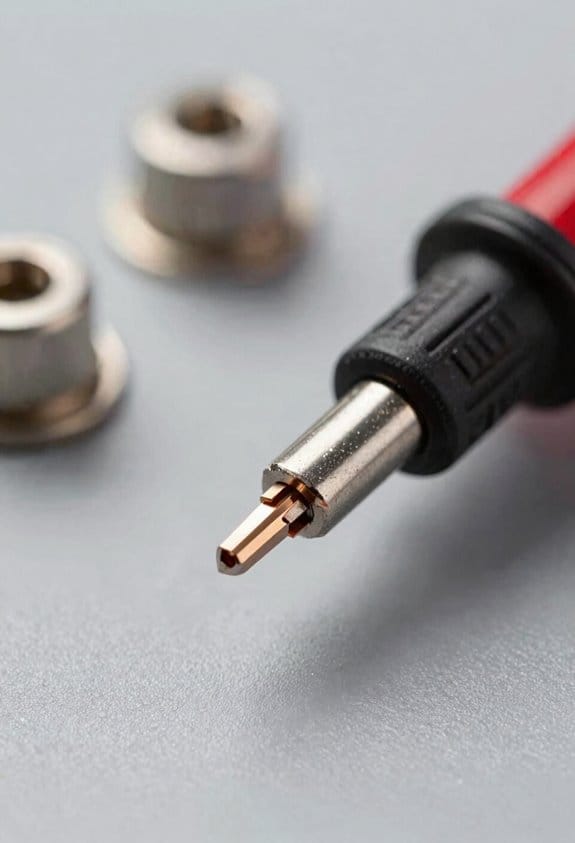
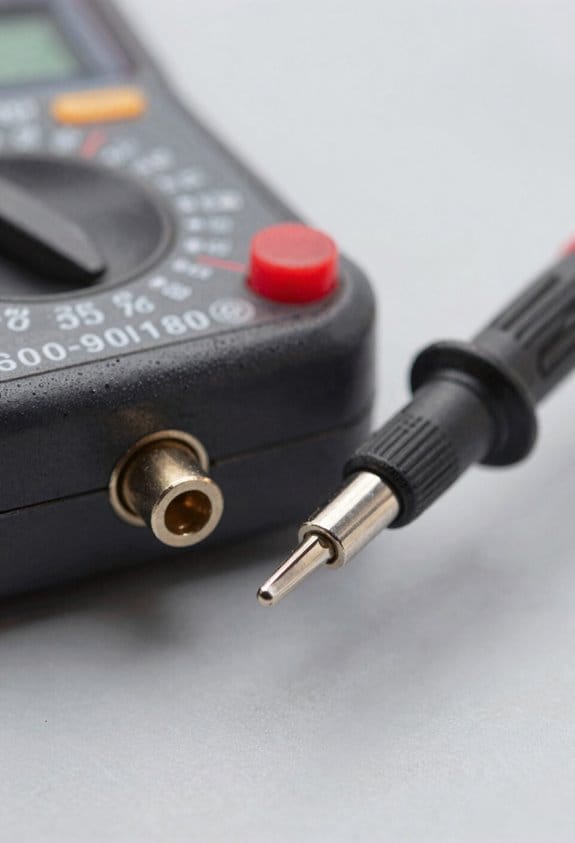
- Use a plug-in power meter (e.g., Kill A Watt or Fluke i410) to record appliance wattage for 24–72 hours; that’s a concrete baseline you can show. Example: plug a Kill A Watt into a compressed-air dryer and capture 48 hours of use to prove average watts and peak draw.
- Use a data logger (set to 1–5 minute intervals) for at least one week to show daily and weekly patterns; this reveals when systems idle or cycle. Example: a bakery’s weekly logger trace showed ovens idling overnight, adding 12% to energy bills.
- Use a thermal camera to photograph heat loss points and save images with timestamps; pair each image with a ruler or coin for scale. Example: a thermal image of a rooftop unit flue showed a 20°C temperature difference and a 2 cm gap you can point to on a repair order.
2) Which instruments to choose and how to document them
Why it matters: choosing the right tool and recording its use makes your findings verifiable.
Steps:
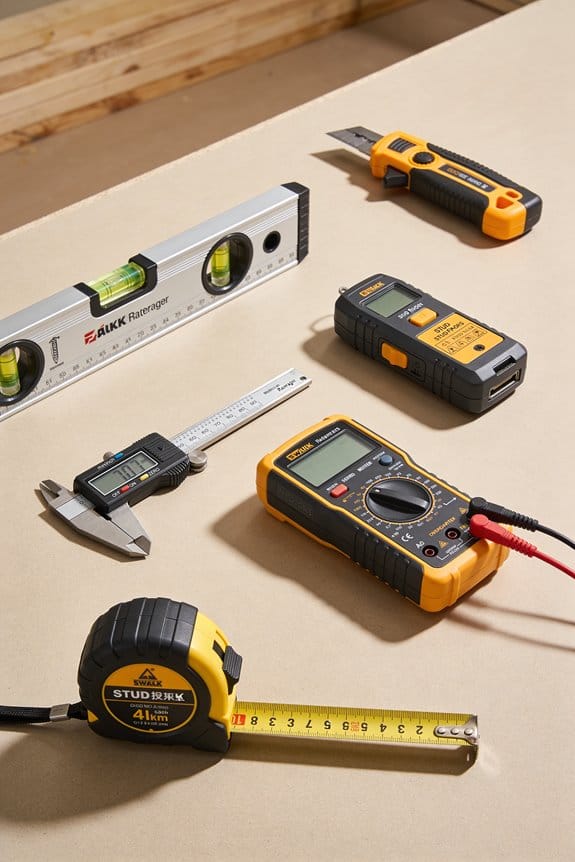
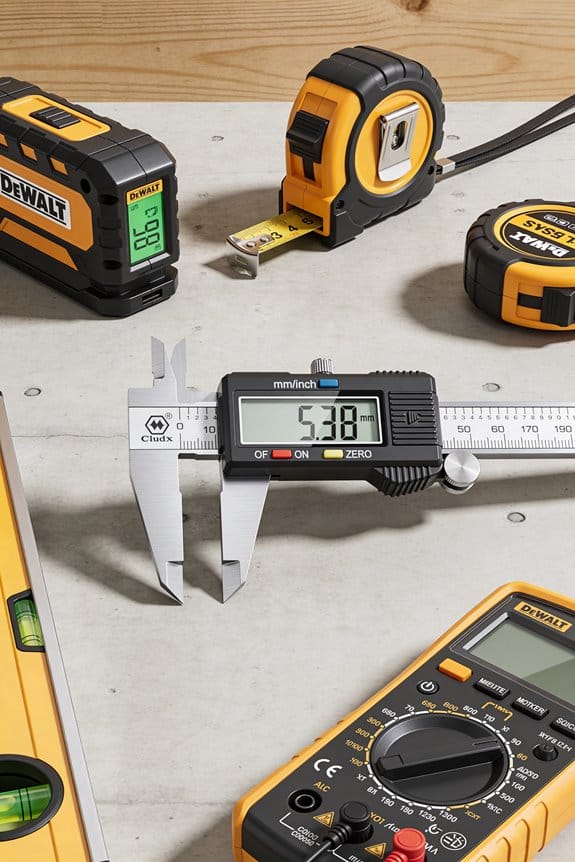
- Pick instruments: one clamp meter, one plug-in meter, one multi-channel data logger, and one thermal camera. Brand examples: Fluke clamp meter, Emporia/Victron data loggers, FLIR thermal camera.
- Calibrate or verify against a known reference every 6–12 months. Keep a scanned calibration certificate with each device record.
- Set sampling rates: 1–5 minutes for loggers monitoring equipment; 1-second or event capture for transient faults.
- Label each file with date, time, device ID, and location. Store raw CSVs plus a PDF summary.
Concrete example: label a CSV “2026-03-20_flour-mill_loggerA_zone3.csv” and attach a calibration certificate from 2026-02-01.
3) How to make audit results stand up in inspections
Why it matters: inspectors want traceability from instrument to claim.
Steps:
- Show chain-of-custody: photographed device at the site with serial number, date, and a person’s initials.
- Provide raw data plus a 1-page summary that lists methods, assumptions, and formulas used.
- Re-run key measurements after repairs or adjustments to demonstrate change.
Example: after sealing a 2 cm gap found with a thermal camera, re-measure energy use for 7 days and compare average daily kWh before and after to quantify savings.
4) Practical schedules and numbers to follow
Why it matters: regular measurement prevents surprises and builds defensibility.
- Do spot checks monthly using plug-in or clamp meters.
- Run continuous logging on critical systems for at least one week every quarter.
- Calibrate instruments every 6–12 months and replace batteries yearly.
Example: create a simple calendar: January full-week loggers, April spot-checks, July repeat full-week logging, October maintenance verification.
Quick checklist to start this week
Why it matters: small steps get you compliant fast.
- Rent or buy one clamp meter, one data logger, one thermal camera.
- Do one 48–72 hour plug-load measurement on a suspect circuit.
- Photograph and label each device on site.
- Save raw files with clear filenames and a one-page summary.
If you follow those steps, your audit will move from guesswork to documented proof, and you’ll have the records inspectors ask for.
How New Tech Expands What Audits Can Prove (IoT, AI, Drones, Digital Twins)
If you’ve ever wondered what audits can actually prove with new tech, this matters because it changes how confident you can be in savings and condition claims.
I can place networks of sensors to form sensor federations that combine readings from HVAC, lighting, and meters, and that gives you continuous, verifiable traces of performance. Example: on a 100,000 sq ft office, I install 60 sensors—temperature, CO2, and power—every 1,500 sq ft; you get minute-by-minute logs you can query for any day. How I do it, step by step:
- Map zones and utility access points.
- Install sensors at 6–8 ft for air sensors and 1–2 ft from panels for power.
- Calibrate against a handheld meter for 5 minutes per sensor.
- Aggregate to a central dashboard with 1-minute resolution.
Result: you can prove a chiller ran at partial load at 2:15 a.m. on June 3.
Before you assume AI will magically prove savings, know why it matters: AI turns raw data into actionable patterns that tie measures to outcomes in your building. I use AI to spot patterns and predict failures so savings claims link to behavior and anomalies, not guesswork. Real example: a grocery store had repeated compressor cycling; an AI model flagged alternation every 37 minutes, and fixing the control logic cut energy use by 9% in three weeks. How I apply AI:
- Label historical events (fault, normal, maintenance).
- Train a time-series model on six months of 5-minute data.
- Validate with a held-out month and a precision target of 85%+.
- Deploy alerts to your ops team with suggested actions.
You get probabilistic confidence scores and a log tying alerts to measured savings.
Think of drone surveys like using a tall ladder you don’t have to climb, because they access areas you can’t safely inspect and capture thermal detail. I deploy drones for infrared surveys of roofs and facades, reaching spots humans can’t safely inspect. Example: on a warehouse roof with 200 skylights, an infrared drone flight at 30 m altitude revealed heat loss around 23 skylights and pooled-water damage around 5 drains. How I run a drone survey:
- Plan flight paths covering all roof zones at 25–40 m altitude.
- Capture RGB and thermal images with geotags every 5–10 seconds.
- Stitch images into orthomosaics and overlay with CAD roof layout.
- Produce a report with GPS coordinates and recommended repairs.
You get thermal evidence with location stamps you can share with contractors.
The difference between static reports and modeled proofs comes down to simulation you can test. I build digital twins with twin orchestration to simulate interventions and show modeled savings, so audits move from snapshots to dynamic proofs you can test and trust. Example: for a 50-room hotel, I created a twin that reproduced occupancy patterns and HVAC responses; simulating occupancy-based setpoint changes predicted a 12% energy drop, which matched a six-week pilot within 1.5 percentage points. How I create and use a digital twin:
- Ingest floor plans, sensor streams, and equipment specs.
- Calibrate the model to two weeks of live data.
- Run intervention scenarios (setback, schedule changes, control tweaks).
- Compare simulated and actual post-implementation data for verification.
You can run repeatable experiments and produce modeled savings with confidence intervals.
Put these pieces together and your audit becomes a chain of evidence: sensor logs, AI-flagged events, drone-verified defects, and twin-modeled savings—all timestamped and geo-referenced so you can test claims and hold vendors accountable.
Recommended Products

UPDATED FIRMWARE: New firmware now available to reduce fan speed and noise issues

Complete Raspberry Pi 5 16GB Kit Integrated: Includes the Raspberry Pi 5 16GB Board, CrowPi 3 with the Raspberry Pi 5 supports OpenCV, facial recognition, object detection, and large language models such as LLMs, offering a comprehensive platform for AI exploration and prototyping
All-in-One Portable Lab: Everything you need is built-in! Start coding & building AI projects in minutes with 40+ sensors, a touchscreen, camera, and mic. No messy wiring, no extra parts to buy.
Top Measurement Tools for Audit Accuracy and Compliance

If you’ve ever walked into an audit and felt overwhelmed by instruments and data, this will help you pick what matters and use it right.
Why it matters: accurate measurements let you prove savings and meet compliance without guesswork. Example: on a retrofit of a 20,000 ft² office I measured before and after to validate a 15% energy reduction claim, avoiding a costly re-audit.
1) Thermal imaging cameras — what to do and why
Why it matters: they show where heat’s escaping so you know where to fix.
Steps:
- Scan exterior walls and roofs on a clear night when indoor/outdoor delta T is at least 10°C (18°F).
- Capture images from 3–5 distances: close (1–2 m), mid (5–10 m), and overall (across the façade).
- Save images with timestamps and ambient temps.
Real-world example: I found a band of missing insulation above a second-floor window by comparing a close shot and a façade-wide image, which led to sealing a 12 W/m·K loss area.
2) Data loggers — how to set up meaningful trends
Why it matters: they prove runtime and temp patterns instead of single snapshots.
Steps:
- Place loggers at representative points: supply air, return air, and one in the occupied zone.
- Sample every 5–15 minutes for at least 7 days, longer if systems cycle weekly.
- Label each device, note location, and record start/end times.
Real-world example: 10 days of 10-minute data showed a unit heater cycling every 40 minutes only on weekends, revealing a scheduling error that cut fuel use by 8%.
3) Ultrasonic leak detectors — where to sweep and how quickly
Why it matters: compressed air leaks waste money and are easy to fix once found.
Steps:
- Walk the piping and fittings during peak system pressure.
- Scan at 0.5–1 m, then move closer to isolate noisy fittings.
- Log leaks bigger than ~2 L/s for repair prioritization.
Real-world example: scanning a production line found a 3 L/s leak at a quick-disconnect that was costing about $1,200/year.
4) Portable power analyzers — what measurements to take
Why it matters: volts, amps, and harmonics reveal inefficient or failing equipment.
Steps:
- Measure L-L and L-N volts, line amps, power factor, and total kW during typical operation.
- Record at least 10 minutes of steady-state data per device.
- Check for >5% imbalance between phases or harmonics above 5% THD.
Real-world example: a motor showed 7% voltage imbalance and 8% THD, which explained a 12% higher motor current and led to corrective wiring that reduced the load.
5) Sensor calibration and baseline validation — the checks you must do
Why it matters: uncalibrated sensors give misleading comparisons.
Steps:
- Verify sensor calibration against a reference instrument before each audit (document offsets).
- For baselines, use at least 30 days of pre-retrofit data or match performance days by temperature and occupancy.
Real-world example: recalibrating a misreading temperature sensor corrected a baseline shift that otherwise would have overstated savings by 6%.
6) Cloud-based EMIS and modeling (EnergyPlus) — when to use them
Why it matters: they aggregate data and test retrofit scenarios so your compliance claims hold up.
Steps:
- Feed your logger and analyzer CSVs into an EMIS and check automated anomaly flags.
- Build an EnergyPlus model using measured internal gains, schedules, and envelope R-values; validate the model against one month of measured data to within ±10%.
Real-world example: after validating the model to 7% error, we tested window upgrades and projected a 9% savings that matched post-install measurements within 1.5%.
Final practical checklist you can use on-site:
- Verify sensor calibration (record offsets).
- Set data loggers to 5–15 minute intervals for ≥7 days.
- Thermal scan at night with ΔT ≥10°C.
- Sweep compressed air under full pressure.
- Capture 10+ minutes of steady-state power data.
- Upload all files to EMIS and validate model to within ±10%.
If you follow those steps, you’ll collect defensible evidence and avoid rework.
Recommended Products

Model E8-XT: Handheld IR camera measures temperatures from -20 to 550°C (-4 to 1022°F)

Model E5 Pro: Handheld IR camera measures temperatures from -20°C to 400°C (-4°F to 752°F)

Leading Manufacturer Of High-Quality Products
Where Measurement Tools Cut Audit Time, Cost, and Show ROI
Here’s what actually happens when you swap slow manual reads for smarter measurement tools: audits get shorter and you start seeing real dollar savings fast.
Why this matters: wasted onsite hours and human errors drive up audit cost and hide where you can save money.
1) Use compact sensors and automated loggers to cut onsite time.
– Step 1: Buy battery-powered temperature/humidity loggers that record every 5–15 minutes.
Example: I used 10 HOBO MX1101 sensors across a 20,000 ft² office for a week and reduced onsite visits from three days to one.
Outcome: you save ~16 hours of technician time and cut data-entry mistakes to near zero.
Tip: place sensors near thermostats, return vents, and workstations for clear patterns.
2) Let continuous data reveal behavior-driven problems before you act.
- Why this matters: one-off reads miss patterns that cause wasted energy.
- Step 2: Run sensors for 7–14 days to capture weekday and weekend behavior.
Example: in a small retail store, seven days of occupancy and plug-load logging showed lights stayed on 40% of the time after close, so switching to vacancy sensors paid back the equipment cost in three months.
Outcome: you can prioritize fixes with the fastest payback.
3) Choose scalable, cloud-connected devices so future audits need less setup.
- Why this matters: setup time and repeated calibration are hidden costs.
- Step 3: Specify Wi‑Fi or LTE loggers that sync automatically and support over-the-air updates.
Example: a facilities team deployed cloud-enabled CO2 and temperature sensors across five buildings; for the next audit they onboarded new sensors in under an hour instead of a full day.
Outcome: you lower recurring labor and get consistent, centrally stored data.
4) Focus measurements on high-impact areas to get verifiable savings faster.
- Why this matters: measuring the wrong things wastes your budget.
- Step 4: Prioritize HVAC airflow, chilled-water temps, and occupancy in that order. Number each target and assign a single sensor type to it.
Example: targeting chilled-water delta-T with inline flow and temp sensors identified a bypassed coil that improved system efficiency by 12% after repair.
Outcome: you spend less on labor and more on actions that prove savings.
Procurement strategy (quick checklist):
- Pick sensors with at least 2 weeks battery life or wired power.
- Require cloud sync and CSV export.
- Buy modular kits so you can scale from one room to whole buildings.
Example: ordering modular kits cut procurement time by 50% for a multi-site rollout.
Final takeaway: use automated, cloud-ready sensors, collect continuous data for 7–14 days, and target a few high-impact measurements. You’ll cut onsite hours, reduce errors, and document ROI with before-and-after data.
Recommended Products

Upgrade from the GSP-6, features Bluetooth functionality for data transfer via Elitech iCold app. It boasts a 3.3-inch display and a large capacity for up to 100,000 data points. Pharmacy DDL with Calibration Certificate to auditor, meets current CDC / VFC requirements and additional recommendations for vaccine storage and monitoring, FDA 21 CFR Part 11 Compliant.

Applicable to multiple scenarios - Applicable to life science, food cold chain and industrial fields, Complies with FDA 21 CFR Part 11 standard.

Upgrade from the GSP-6, features Bluetooth functionality for data transfer via Elitech iCold app. It boasts a 3.3-inch display and a large capacity for up to 100,000 data points. Pharmacy DDL with Calibration Certificate to auditor, meets current CDC / VFC requirements and additional recommendations for vaccine storage and monitoring, FDA 21 CFR Part 11 Compliant.
How Sub‑Metering and Data Accuracy Verify 15–25%+ Savings
If you’ve ever wondered whether your efficiency tweaks actually save money, this shows why verification matters. You need proof when you claim 15–25%+ savings so incentives, tenants, and auditors will believe you.
Here’s how to verify savings with sub‑metering and accurate data, step by step.
1) Isolate what you’re measuring and why it matters.
- Why: If you can’t separate loads, you can’t assign savings to a specific measure.
- How: Install sub‑meters on the exact circuits, equipment, or tenant panels tied to the project. For example, put a kWh meter on a rooftop AHU circuit and one on the lighting panel the same day you start retrofit work.
- Real example: At a 100,000 ft² office, we metered two rooftop units and the lighting panel separately; that let us show rooftop HVAC runtime dropped 20% and lighting dropped 30%, not just a vague whole‑building number.
- Takeaway: Meter the specific piece of gear you changed.
2) Calibrate baselines so before‑and‑after comparisons are valid.
- Why: A bad baseline makes your savings estimate meaningless.
- How: Collect at least 30 days of pre‑retrofit data under typical operating conditions, correct for any meter bias with a 1–2 point calibration check, and log occupancy or weather differences that affect load.
- Real example: For a retail store, we captured 45 days before a lighting retrofit, corrected a meter offset of 2.5%, and adjusted the baseline for two weekend clearance sales that spiked usage.
- Takeaway: Use real operating data and fix meter error before you claim savings.
3) Use accurate meters and quantify uncertainty.
- Why: Meter accuracy changes reported savings by several percentage points.
- How: Pick meters with at least ±0.5% active energy accuracy for savings work, document their spec sheets, and run a quick field comparison against a reference meter weekly for the first month.
- Real example: We swapped a ±2% meter for a ±0.5% unit and reduced uncertainty in a 20% savings claim to ±1.5 percentage points, tightening the incentive calculation.
- Takeaway: Buy better meters where the money depends on the number.
4) Gather continuous data and look for persistent waste.
- Why: Snapshot reads miss recurring waste patterns that reduce realized savings.
- How: Collect interval data (5–15 minute) for both pre‑ and post‑periods, plot runtime and kW curves, and flag nights or weekends where equipment runs unnecessarily.
- Real example: Continuous data found a chilled‑water pump cycling every night between 2–4 AM; fixing controls cut pump energy by 40% during those hours.
- Takeaway: Use interval data to find and fix repeatable waste.
5) Cross‑check with utility bills and reconcile differences.
- Why: Bills are the final money metric; metered aggregates must align with them.
- How: Aggregate sub‑meter kWh by billing period, compare to the utility invoice, and reconcile any 1–3% gaps by checking CT ratios, meter wiring, or billing demand adjustments.
- Real example: A 4% gap traced to an incorrectly recorded CT ratio on the main meter; correcting it matched invoices within 0.8%.
- Takeaway: Reconcile meters to bills before you finalize savings.
6) Document and present verifiable results.
- Why: Stakeholders need clear evidence to approve incentives or accept guarantees.
- How: Produce a one‑page summary showing baseline, post‑period, percent savings, meter accuracy, and reconciled bill comparison, plus raw interval files for auditors.
- Real example: The one‑page summary helped a property manager approve a performance contract that paid out after independent validation.
- Takeaway: Give stakeholders clean, auditable numbers.
Follow these concrete steps and you’ll move from rough estimates to verifiable, repeatable savings claims.
Roadmap to Add Measurement Tools to Your Audit Workflow
If you’ve ever tried to add measurement tools and felt overwhelmed, this will make it simple and practical.
Why this matters: you need reliable data to make better audit decisions. Start with a short plan: write two sentences that state what you want to measure and why—example: “Measure whole-building electricity and peak HVAC demand to cut peak charges by 15%.”
1) What should you measure and why?
Why this matters: clear objectives keep you from buying gear you won’t use.
Steps:
- List 3 metrics: total energy (kWh), peak demand (kW), and runtime hours for major equipment.
- Assign targets: for example, 10% energy reduction and 15% demand reduction over 12 months.
Real-world example: at a 50,000 ft² office, measuring main service kW and two rooftop unit runtimes revealed a 20% overnight setback opportunity.
2) How do data flows work?
Why this matters: if sensors don’t feed a central place, data is useless.
Steps:
- Map sources: mains meter, submeter panels, equipment power loggers, and BMS outputs.
- Choose a central repository: a cloud database or local historian that accepts CSV, MQTT, or BACnet/IP.
Real-world example: a retail chain used CT-clamp submeters sending MQTT to a cloud bucket every 5 minutes; store managers accessed dashboards within 24 hours.
3) How should you phase the rollout?
Why this matters: piloting reduces risk and cost.
Steps:
- Pick 1–3 pilot sites representing typical conditions.
- Run pilots for 4–8 weeks to validate sensors, sampling rates, and reporting.
Real-world example: a multifamily portfolio piloted one building for 6 weeks and found they needed one extra CT on the lobby chiller, avoiding a full-portfolio rework.
4) Where do you install sensors?
Why this matters: wrong placement gives misleading readings.
Steps:
- Install mains CTs at the service entrance and submeters on large loads (HVAC, kitchen, elevator).
- Place room-level sensors in representative zones: busiest office floor, main corridor, and mechanical room.
Real-world example: on a hospital floor they installed CTs on the main AHU and two zone reheat coils and immediately identified a coil stuck open during nights.
5) What sampling rates and storage should you set?
Why this matters: sampling affects both insight and costs.
Steps:
- Use 1-minute intervals for transient events and 5–15 minute intervals for steady trends.
- Keep raw 1-minute data for 30 days, then downsample to 15-minute averages for 2 years.
Real-world example: a data center used 1-second sampling on critical circuits for 7 days and 1-minute after that, catching a cooling relay chatter that occurred every 90 seconds.
6) How do you validate data and report?
Why this matters: bad data leads to bad actions.
Steps:
- Create a validation checklist: sensor calibration, timestamp sync, expected ranges, and gap detection.
- Produce weekly reports with: metric trends, anomaly flags, and one recommended action.
Real-world example: during a pilot, validation caught a miswired CT that reported negative kW; fixing it changed monthly billing estimates by 12%.
7) How do you train stakeholders?
Why this matters: tools only help if people use them.
Steps:
- Run two 60-minute sessions: operators on tool operation and managers on dashboards and KPIs.
- Provide one-page cheat sheets with procedures and contact info.
Real-world example: after a one-hour workshop, maintenance staff began submitting weekly observations that matched automated anomaly alerts.
8) How do you iterate after the pilot?
Why this matters: you’ll always find small fixes that improve results.
Steps:
- Review pilot data and logs, list 5 changes (sensor moves, sampling tweaks, dashboard filters).
- Implement changes at one pilot site, then schedule a 3-month check.
Real-world example: iteration added a current transformer on a rarely-used subpanel and uncovered a phantom load of 2 kW during off-hours.
Final practical checklist (do these in order):
- Write 2-sentence objective.
- Map data sources and pick a repository.
- Select 1–3 pilot sites and schedule 4–8 week pilots.
- Install mains CTs and submeters at major loads.
- Start with 1-minute sampling, downsample after 30 days.
- Run validation checklist weekly.
- Train staff with two 60-minute sessions and cheat sheets.
- List 5 pilot-driven changes and re-check in 3 months.
One last clear tip: budget about $3,000–$8,000 per pilot site for meters, CTs, cloud storage, and 8 weeks of labor—adjust by site size.
Recommended Products

COMPREHENSIVE 3-PHASE ANALYSIS: Monitor and troubleshoot complex power distribution systems with ease. This kit tracks 35 critical parameters, including phase-to-phase voltage, reactive power, and phase angle for a total system overview.

【 COMES WITH DISPLAY】Can directly calculate the current power value.The sensor comes with display with a resolution of 128x64.
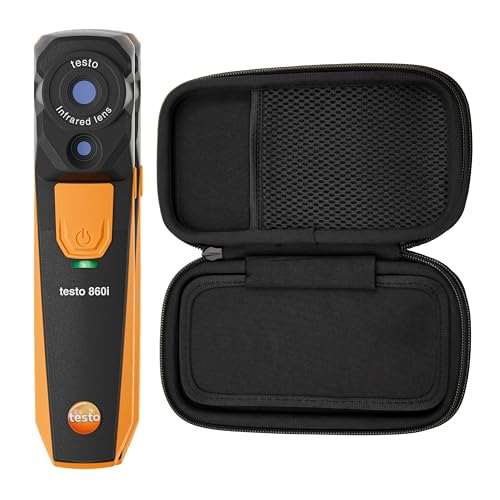
Wireless Connectivity; The testo 860i wireless thermal imaging camera connects to your mobile device with Bluetooth and Wi-Fi enabled via the Testo Smart App for quick and efficient inspections (requires iOS 17+/Android 14+ and Bluetooth 4.0)
Choosing the Right Toolset for Your Portfolio and Compliance Goals
If you’ve ever tried buying tech for a building portfolio, this is why tool choice matters: the wrong mix raises costs, risks noncompliance, and gives you useless data.
Why this matters: picking the right tools saves money and keeps you compliant. Example: a 50,000 ft² office with variable occupancy saved 18% on energy bills after switching from monthly utility checks to continuous sensor monitoring.
1) How do you align tools to your portfolio?
Why this matters: tools should match building type so you get useful signals.
Steps:
- Segment your portfolio by three criteria: size (small <10k ft², medium 10–100k ft², large >100k ft²), use (office, retail, multifamily), and risk (high = public-facing or historic).
- Prioritize: focus first on large and high-risk buildings; these typically deliver 60–70% of potential savings.
- Assign a primary tool per segment: continuous sensors and an EMIS for large offices, monthly submeters for medium retail, and portable thermal cameras for small multifamily.
Example: a 120k ft² downtown office got sensors on HVAC zones and a cloud EMIS, which identified a 10% chiller inefficiency in two weeks.
2) What compliance requirements should drive accuracy and retention?
Why this matters: regulations dictate how precise your data must be and how long you need to keep it.
Steps:
- Create a compliance map: list mandates, required reporting frequency, precision tolerance (±%), and retention duration (months/years).
- Match data needs to tool specs: choose meters certified to the required accuracy (e.g., ±1% for billing-grade), and storage systems with retention policies (e.g., 7 years for tax-related reporting).
- Set an audit plan: schedule quarterly spot checks and an annual full data audit.
Example: a portfolio owner in a city with annual emissions reporting kept raw one-minute sensor logs for three years to satisfy both local and lender requirements.
3) Which technologies serve what purpose?
Why this matters: each technology has specific strengths and costs you should weigh.
Steps:
- Ongoing monitoring: use wired/wireless sensors + EMIS for continuous data; budget $50–$150 per sensor installed and $2–$10 per unit per month for cloud analytics.
- Spot diagnostics: use thermal cameras and portable loggers; a handheld thermal camera costs $300–$3,000 depending on resolution.
- Planning and forecasting: use energy modeling software for capital planning; expect $5k–$25k per model or subscription tiers for larger portfolios.
Example: an owner used a $1,200 thermal camera to find insulation gaps in a retail unit, reducing heating demand by 12% after fixes.
4) How do you ensure the toolset will scale and interoperate?
Why this matters: tools that don’t talk to each other become waste.
Steps:
- Require open APIs and standard protocols (BACnet, Modbus, MQTT) in procurement specs.
- Pilot for 3–6 months on 2–3 representative buildings before wider rollout.
- Verify vendor support: ask for a 30–60 day SLA and a clear escalation path.
Example: a 30-site rollout used a 6-site pilot; after fixing integration issues with a middleware provider, full deployment took half the expected time.
5) How should you budget and staff for implementation?
Why this matters: underbudgeting kills projects; overstaffing wastes money.
Steps:
- Budget line items: hardware (30–40% of project), software/subscriptions (20–30% annually), installation (10–20%), and professional services/training (10–20%).
- Staffing: assign one part-time internal owner per 25 buildings plus an external integrator during deployment.
- Plan for training: schedule two 2-hour sessions per building for ops staff and one month of vendor support.
Example: a portfolio allocated $150k upfront and one FTE shared across 40 buildings; that combination cut vendor fees by 25% and improved data uptake.
Final actionable detail: run a 3–6 month pilot on one large and one small building, require open APIs in contracts, and budget roughly 30–40% of the project cost for hardware plus recurring software fees of $2–$10 per device per month.
Recommended Products

Effortless All-In-One Design – Fully self-contained unit with integrated cooling, heating, and filtration systems. No plumbing or installation required — simply plug it in, fill it with water, and immediately start your cold therapy or warm soak experience, with a foot-draining tray included for easy water drainage and clean use
Ideal for Premium Property Owners: The Yarbo Lawn Mower Pro features modular design, strong cutting system and fully autonomous navigation for low-effort, reliable lawn care. It cuts thick, wet, overgrown grass with ease, suitable for homes, golf courses, turf farms, luxury hotels and resorts.

COMMERCIAL USE: Office paper shredder designed for 20-25 users in a department, floor or office; TAA compliant, Made in Germany
Frequently Asked Questions
How Do Measurement Tools Affect Building Insurance Premiums?
Like a lighthouse guiding ships, I tell you measurement tools lower risks and can earn insurance discounts by improving risk modeling; insurers see verified data, reduced claims, and reward proactive monitoring with lower premiums and faster claims handling.
Can Audits Using These Tools Be Used as Legal Evidence in Disputes?
Yes — I believe audit data can be legal evidence if you maintain a clear chain of custody, use validated measurement tools, and present findings via an expert witness who can testify to methods, accuracy, and relevance.
What Data Privacy Risks Come With Iot and Cloud-Based Audit Tools?
You’re right to worry: I see risks like unclear data ownership, weak encryption standards, insecure APIs, vendor lock-in, unauthorized access, and cloud misconfigurations exposing tenant or behavioral data—so I push for strict contracts and robust encryption standards.
Are There Standardized Certifications for Auditors Using Digital Measurement Tools?
Like a compass in fog, yes — I’ll say it plainly: certification standards exist (e.g., BPI, ASHRAE, ISO) and auditor accreditation programs are growing, though formats vary between jurisdictions and digital tool endorsements are still evolving.
How Do Small Building Owners Afford Initial Sensor and Sub‑Metering Costs?
I recommend shared financing and staggered deployment: I’d tap rebates, performance contracts, and on‑bill financing, deploy low‑cost sensors first, then add sub‑meters as savings justify investment, and pursue incentives to lower upfront risk.