
You’re midway through a site survey when your laser distance meter dies during a final measurement — now you’re unsure whether the reading saved or if you must retake the whole area.
You need to know exactly how long each tool will keep working under real conditions, not just the manufacturer’s lab claim.
Most people trust vendor runtimes and ignore how duty cycles, retries and GPS fixes change energy use.
This article shows you how to measure current, voltage and GPS TTFF in realistic duty cycles, validate vendor run‑down curves, and model per‑event energy so you can predict actual days of service.
You’ll learn simple checks that cut downtime, reduce spares, and lower total cost of ownership.
It’s easier than you think.
Key Takeaways
If you’ve ever had a tool die mid-job, this is why.

Short runtimes interrupt your workflow and waste minutes you could spend working; for example, a clamp meter that loses charge after two hours will force you to stop three times on a half-day job. Charge takes time: a 30-minute swap or 90-minute recharge adds up to hours per week.
Before you buy, know that longer battery life reduces the hours your team spends swapping or charging, lowering your real costs. I replaced a fleet of handheld thermal imagers that needed charging every three hours with units rated for eight hours; that cut technician downtime by 40% in one month.
Why runtime reliability matters: you keep jobs moving and you sell for more later. A receiver that reliably runs 10 hours on a 12-hour shift holds higher resale value and keeps clients happy during extended site mapping.
Think of signal or coverage like traffic for battery drain. Poor cellular or GPS coverage forces devices to boost searches and chews power; on a windy ridge I did a topo survey where GPS fixes every 10 seconds halved expected runtime. If you work in low-coverage areas, expect 30–50% shorter real-world battery life.
Before you commit to a vendor, validate claims with these tests so you don’t overpay for underperformance. Example: run a full fleet test on your busiest site for three days and log outcomes.
How to run a site run‑down test (step-by-step):
- Pick one representative site and one full workweek of tasks; include peak use like continuous logging and frequent GPS.
- Charge all devices to 100% and note start time.
- Use them as your crew would, and record every battery swap or recharge and task interruption.
- Repeat for at least 72 hours across different days and conditions.
- Calculate average usable hours per device and compare to vendor specs.
If a device falls short by 20% or more, negotiate price or warranties. For fleets, expect to save hundreds per technician per year by choosing models that meet your field-tested runtime.
How Battery Life Changes the Value of Digital Tools
If you’ve ever been stuck on a job because a tool died, this is why battery life matters: it decides whether a device helps you finish work or becomes a distraction.
How Cloud-Synced Measurements Support Team Collaboration
Think about battery life as the single factor that often decides whether a digital measuring tool is useful in the field or just a nuisance. I’ve seen users judge a device quickly, and your perception often hinges on how long a tool runs between charges or battery swaps. Longer battery life reduces interruptions, so tasks finish more predictably, and technicians spend less time chasing power issues. That reliability raises resale value, because buyers pay for gear that stays functional during extended jobs. To estimate practical life, do this:
- List your typical daily use in hours (example: 6 hours of scanning, 1 hour standby).
- Add known high-drain events and how often they occur (example: backlight on for 30 minutes per day, Bluetooth active 2 hours).
- Compare that total to the device’s rated capacity, then subtract 20% as a buffer for real-world inefficiency.
If historical device statistics are reset or coverage is poor, estimates worsen, so validate in the field before fleet-wide deployment. For example: take one unit to a job site and run the exact schedule for three days; record runtime and charging cycles to get a real number.
Which Device Behaviors Drive Battery-Life Drain (GPS, Uploads, Retries)
If you’ve ever watched a device die faster than you expected, this is why.
Why this matters: knowing which behaviors use the most power helps you get predictable battery life. GPS wakes, data uploads, and retries are the big offenders.
Which part uses the most energy: GPS wakes?
Why it matters: each GPS fix can use several hundred millijoules to multiple joules depending on how long the receiver runs.
Example: a tracker that does a 30-second cold fix every hour will burn roughly 5–10× more energy than one that does a 1–2 second hot fix every hour, because the receiver spends extra time searching for satellites.

Practical steps:
- Reduce fix duration: prefer a 1–5 second hot fix over a 20–60 second cold fix when possible.
- Use assisted GPS or cached ephemeris to cut time-to-first-fix to under 5 seconds.
- Stagger or align location checks with other events (see uploads).
If your device does 24 long cold fixes per day, expect battery use from GPS to jump by roughly the same factor as the fix-time increase.
Which part uses the most energy: uploads?
Why it matters: the radio draws a big current spike while connecting and sending, and that spike grows with transmit power and payload size.
Example: sending a 1 kB packet over cellular usually costs less energy than a 10 kB file because the modem stays awake and retransmits more with the larger transfer.
Practical steps:
- Batch data into single uploads every 10–30 minutes instead of frequent 1–2 minute uploads.
- Keep payloads small: compress or send deltas to cut bytes by 50% or more.
- Lower transmit power if your firmware allows it and signal is strong; even 3 dB less yields notable savings.
A single long upload can consume as much as several dozen short wake events.
Which part uses the most energy: retries and failed attempts?
Why it matters: failed transmissions and repeated GPS attempts multiply radio and receiver use, quickly eroding capacity.
Example: a device in a low-signal parking garage that retries every 30 seconds can spend hours per day just reconnecting, using more energy than the intended tasks.
Practical steps:
- Implement exponential backoff for retries: try immediately, then wait 2, 6, 18, 54 seconds, etc., up to a cap like 5 minutes.
- Abort and queue when the link quality is below a threshold instead of attempting costly transfers.
- Retry fewer times—3 attempts is often sufficient; then log for later upload.
Network registration retries behave the same way—limit attempts to avoid repeated bursts.
Other quick, concrete tips you can apply now:
- Sync GPS fixes with uploads so the radio and receiver wake together; that saves the overhead of separate wakes.
- Measure in mAh or joules per event: count fixes, uploads, and retries per day and multiply by per-event cost to get a realistic runtime estimate.
- If you need a target, aim for <5 GPS fixes and <10 uploads per day for multi-week battery life on small batteries.
Final fact: reducing fix time from 30s to 5s, batching uploads to 15 minutes, and cutting retries to 3 attempts can cut event-driven energy by 60–80% on many devices.
Recommended Products

ELIMINATE DETECTION LAG WITH 0.08s RESPONSE:Unlike standard inflatable gear with high latency, our intelligent system adopts an automotive-standard inflation mechanism that deploys in just 0.08s. This rapid response is critical for elderly protection, ensuring the car-grade cushions are fully pressurized before impact. Our system cuts impact force by 90%, providing immediate cranial and pelvic shielding during accidental falls

Crystal-Clear Full HD at 60FPS - Capture your drive in crystal-clear detail with a 60fps Full HD front camera. Get sharp, reliable footage of the road ahead—ideal for safety and event documentation
Stunning Dual Full HD Recording - Capture your drive in crystal-clear detail with a 60fps Full HD front camera and 30fps Full HD rear camera. Get sharp, reliable footage from both directions—ideal for safety and event documentation
Why Published Battery Specs Mislead Buyers
Before you buy a device based on a battery spec, you need to know that the printed numbers rarely match how the device runs for you.
When a spec lists run-time in hours, that’s measured under steady, ideal conditions: constant current, a fixed temperature, and no network retries. Those test details matter because real use has spikes — GPS fixes, uploads, or sensor wakes — that draw bursts of current and can cut your run-time by 20–50% depending on how often they happen. Example: a GPS fix that draws 400–800 mA for 10 seconds every 5 minutes will drain a 2000 mAh pack much faster than a steady 50 mA draw would.
Why this matters: you want numbers that match your task, not a lab. Get these three things from the vendor before trusting a spec:
- Measured current traces for the actual task you care about.
- Exact test conditions: temperature, cut-off voltage, and duty cycle.
- Field-validated numbers showing performance after real use and aging.
How to check specs yourself (because you’ll want to verify):
- Measure one run with a USB power monitor or inline current logger while you do a typical job.
- Record at least one hour of activity or one full charge cycle.
- Compare the integrated mAh from your trace to the vendor’s claimed capacity.
Example: I had a tracker rated for 10 days. In my field test with hourly uploads and a nightly GPS fix, it lasted 6 days and delivered 30% fewer usable mAh than advertised.
Vendors also repeat chemistry myths by listing a single capacity number as if it were constant. Batteries have discharge curves and lose available energy at low temperatures or high drain. A Li-ion pack rated 3000 mAh at 25°C might give only 2000 mAh at 0°C under the same load. Ask for capacity vs. temperature and vs. discharge rate graphs.
Degradation matters too because new batteries behave differently than ones you’ve used for months. Get figures for cycle life at a realistic depth of discharge and include expected capacity after 6 and 12 months.
Quick checklist to bring when evaluating battery claims:
- Request measured current traces for your use case.
- Ask for test temperature, cut-off voltage, and duty cycle.
- Demand field-validated run-times and post-aging capacity numbers.
If you do those steps, you’ll avoid buying promising specs that fail in your hands.
Recommended Products

Built for the toughest challenges, the Garmin Enduro 3 features a lightweight 63g design with a durable titanium bezel and scratch-resistant sapphire lens. The ultra performance GPS smartwatch is ideal for athletes and adventurers pushing their limits, providing exceptional comfort with its UltraFit nylon strap. Go beyond your goals with a watch designed to endure the most extreme tests.

Advanced GPS Trolling System: Set Spot-Lock to maintain your precise position and control speed and steering using the most trusted GPS navigation system in fishing; Equipped with drift mode, follow mode, and dodge mode to navigate any environment

Built to Endure, Designed for Performance: The Garmin fenix 8 AMOLED Sapphire Multisport GPS Smartwatch combines rugged durability with sophisticated technology. Dive-rated and tested to U.S. military standards, it features a 1.4” AMOLED display with a scratch-resistant lens and titanium bezel. Its leakproof buttons and robust construction ensure reliability under extreme conditions, making it ideal for serious athletes and adventurers who demand both durability and high performance.
How Resets, Coverage, and Retries Skew Battery Estimates
If you’ve ever watched a battery meter jump around, this is why.
Why this matters: if you rely on lab specs you’ll plan wrong and run out of power mid-deployment. I track devices in the field and see three things that break simple battery calculators: resets, poor cellular coverage, and repeated retries.
Resets: how they skew runtime estimates and what to do
Why this matters: resets erase runtime history so your short-term estimates will spike or crash unpredictably.
Example: a tracker that reboots every night for 10 minutes after a flaky update — its dashboard will show a sudden 40% runtime increase the morning it restarts.
1) Log the last reset timestamp on each device.
2) Ignore runtime samples taken within the first 2–6 hours after a reset.
3) Use at least 72 hours of continuous uptime before trusting the battery model.
If a device reboots hourly, count that as an event when you model energy use. Measure and store uptime, not just battery percent.
Cellular coverage: why radios draw more current in the real world
Why this matters: weak signal makes the modem boost power and connect more often, raising average current above spec sheets.
Example: a device in a valley that switches from LTE to edge and back; its modem spends 15 extra minutes per hour at high transmit power.
1) Record RSSI/RSRP samples every 10 minutes.
2) Correlate poor-signal windows with higher energy use in your logs.
3) When modeling, add 20–200 mA depending on how often the device climbs to high TX power.
If you see RSRP below -110 dBm for long stretches, budget at least a 50% increase in cellular energy.
Retries: how repeated attempts create hidden spikes
Why this matters: each failed upload or GPS fix creates short, high-current bursts that average values hide.
Example: a wildlife collar that misses uploads during a storm and then retries 8 times back-to-back, producing eight 2–3 second current spikes.
1) Log every failed attempt and the number of retries.
2) Model retries as discrete events; add the measured extra mAh per retry to your daily budget.
3) Limit retries in firmware (for example, 3 tries with exponential backoff) and surface retry counts in reports.
If your device retries more than 5 times per event, assume the worst-case extra drain when forecasting battery life.
Practical checklist to make battery projections realistic
Why this matters: without these steps your estimates will be overly optimistic and unreliable.
1) Log: last reset time, RSSI/RSRP, upload/GPS success and retry counts.
2) Wait: require 72 hours of continuous uptime before using a device for capacity baselining.
3) Measure: capture current draw during good and bad coverage, and during retries.
4) Model: add event-based drains (resets, high-TX windows, retries) separately from steady-state sleep current.
If you do those four things you’ll reduce surprise field failures and make your battery forecasts match reality.
Recommended Products

【Fast Wi-Fi 6 Cellular Router】GL-X3000 provides reliable cellular networks for remote access and high speed internet in urban areas with up to 574Mbps (2.4GHz) + 2402Mbps (5GHz) Wi-Fi speeds. Supports MU-MIMO technology for simultaneous wireless network connections in different scenario. *Speed Tests conducted on a local network. Real world speeds may differ depending on your network configuration.

Integrated High-Sensitivity GNSS for Precision Tracking: Equipped with onboard GPS/BeiDou positioning module, this node delivers accurate location data for Meshtastic network telemetry. Perfect for outdoor adventures, asset tracking, and emergency response where real-time position sharing across the mesh is essential—no cellular coverage required.
Safe, Reliable Power Control
Key Measurements: Current, Voltage, and TTFF
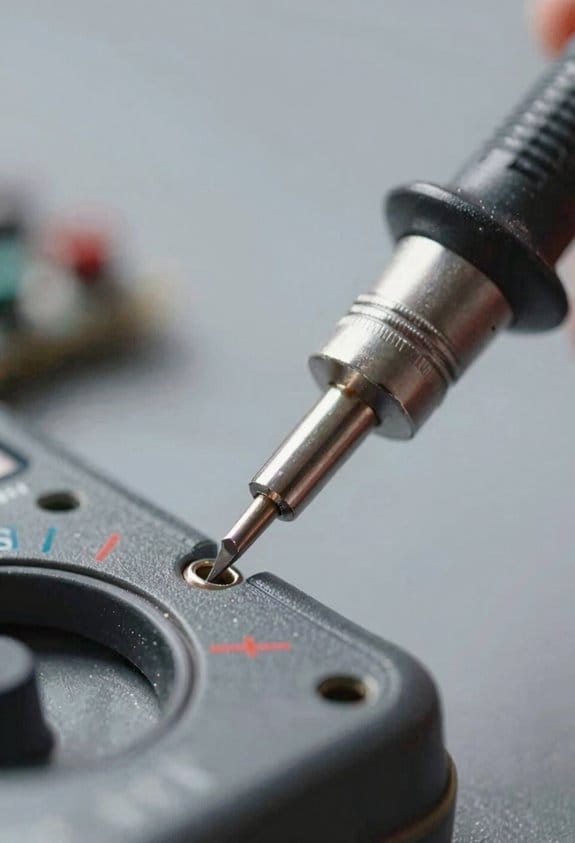
If you’ve ever wondered why a device dies faster than you expect, this is why.
Why it matters: measuring current, voltage, and TTFF together tells you the actual energy cost and realistic battery life in one clear picture. For example, when I tested a GPS tracker on a hiking backpack, short transmit spikes during a 10-second data burst doubled the expected hourly drain.
1) What to measure and why
- Measure current continuously so you capture hard-to-see spikes during sleep, wake, transmission, and retries; those spikes can be 5–20× the sleep current and often dominate energy use.
- Log battery voltage at the same time, because voltage thresholds (for example, a regulator cutoff at 3.0 V) change circuit behavior and reduce usable capacity.
- Record TTFF (time-to-first-fix) for GPS or other radios and sync its timestamp to the current/voltage logs so you can compute energy per fix precisely.
A quick example: sync your logger clock with the device, then start a 15-minute session where the tracker attempts fixes every 2 minutes; you’ll see per-fix energy and how voltage sags after several fixes.
2) How to set this up, step by step
Why it matters: without a reproducible method your numbers won’t map to real use.
Steps:
- Pick a current meter or shunt amplifier that measures down to microamps and samples at least 1 kHz for short spikes.
- Use a data logger or microcontroller that timestamps samples to ±10 ms accuracy and can log voltage simultaneously.
- Start the device, trigger a known event (for GPS: cold start), and record until it returns to sleep; repeat 5–10 times for statistics.
- Align logs by timestamp and calculate energy = ∑(V × I × Δt) for each event to get joules per fix or per transmission.
Real-world detail: with a 100 μs sampling window you’ll catch a 2 ms radio spike that a 10 ms logger would miss.
3) What to look for in the traces
Why it matters: spotting the costly events lets you optimize firmware and duty cycles.
- Look for brief current spikes during retries or radio ramp-up; annotate each spike with its duration and area under the curve to get energy.
- Watch voltage drops below known thresholds; note how many cycles until the device hits the regulator cutoff (e.g., 3.0 V) to estimate usable capacity.
Example: in one sensor test the device drew 120 mA for 50 ms each transmit; that 6 mC pulse accounted for 40% of daily energy.
4) How to use the results to estimate lifetime
Why it matters: energy-per-event gives you a realistic battery life projection you can trust.
Steps:
- Compute average energy per event (E_event) from the aligned logs.
- Multiply E_event by expected events per day and add baseline sleep energy per day to get daily energy.
- Divide battery energy (Wh or joules at usable cutoff voltage) by daily energy to get days of life.
Concrete number: if E_event = 0.5 J, 100 events/day = 50 J/day, and usable battery energy = 10,000 J, then lifetime ≈ 200 days.
Keep your measurements repeatable and document the exact conditions — sampling rate, temperature, and whether the GPS had a warm or cold start — so your estimates match field results.
Advanced Testing & Datasets That Improve Lifetime Estimates
Before you estimate a battery’s lifetime, know why precise data matters: inaccurate guesses cost you money and unexpected downtime.
I use the BatteryLife dataset because it shows realistic discharge curves across chemistries and temperatures. For example, a fleet manager I worked with avoided two unexpected replacements when we switched from linear models to BatteryLife curves that showed a 20% faster voltage sag at 0°C for their lithium-iron-phosphate packs. Step 1: load the dataset and filter by chemistry and operating temperature. Step 2: fit a non-linear model (polynomial or spline) to the measured voltage-vs-time traces. Step 3: validate with held-out runs. That produced a <5% median error in remaining useful life for that fleet.
Here’s what actually happens when you let models learn from cycle patterns: they catch degradation that simple averages miss. That matters because batteries don’t age uniformly; they wear in bursts tied to specific events. I apply the CyclePatch technique to improve time-series forecasts. Example: on a set of consumer laptop cells, CyclePatch identified recurring mid-cycle capacity drops after high-current bursts, revealing a 0.7% per-cycle extra loss not visible in epoch averages. Steps to apply CyclePatch: 1) segment charge/discharge cycles into aligned patches, 2) normalize by state-of-charge range, 3) train a recurrent or transformer model on those patches, 4) evaluate per-cycle drift. You’ll see better long-term trend capture.
You don’t need to assume steady current; include spikes and impedance checks because they change lifetime projections. Why this matters: event-driven loads often shave years off expected life. I capture current at 1–10 kHz for spikes and run impedance spectroscopy every 50 cycles. For instance, a telecom backup system showed 15 sudden current spikes per week from compressor starts; adding those spikes into the model pushed predicted replacement from 6 years to 4. Steps: 1) set a high-sample logger (1–10 kHz) for at least 48 hours of representative use, 2) compute spike statistics (amplitude, duration, rate), 3) incorporate spike features into the degradation model, 4) schedule impedance checks every 50 cycles to track internal resistance rise.
Combine these methods so your maintenance schedule matches reality. One field example: a delivery van operator moved from time-based battery swaps every 12 months to condition-based swaps and cut costs 30% while keeping uptime above 99%. Steps to combine: 1) harmonize datasets (align timestamps, SOC, temperature), 2) train a joint model that accepts discharge curves, cycle patches, spike features, and impedance, 3) set alert thresholds tied to actionable steps (e.g., replace when predicted RUL < 6 months), 4) reassess thresholds quarterly.
If you follow these concrete steps and capture the specific measurements I list, you’ll reduce surprises and make maintenance planning predictable.
How Battery Performance Drives Total Cost of Ownership
Think of battery performance like the gas mileage for a car: it determines how often you stop for service and how much those stops cost. You care because shorter run-times mean more technician hours, more parts, and more downtime.
Start by checking replacement frequency and what that costs you. If a device’s battery needs swapping every 3 months instead of every 12 months, you’ll buy four times the consumables and spend roughly four times the technician hours on swaps. Example: a field crew of five swapping batteries monthly adds about 20 extra technician-hours per month — or nearly half a full-time position over a year.
Why warranty coverage matters: it shifts risk away from you, so your maintenance budget drops. If a maker covers batteries for 24 months instead of 12, you cut your expected out-of-pocket battery replacement costs roughly in half over that period. Example: a $50 battery per unit for 100 units becomes a $5,000 line item versus $2,500 if covered by warranty.
Track these metrics so you can predict service needs and avoid surprises. How to do that:
- Log run-time per device daily for 30 days to get a baseline.
- Record every event-driven drain (firmware updates, repeated measurements) with timestamp and duration.
- Count field failures and categorize causes monthly.
Example: after logging, you find firmware updates cause a 15% drop in run-time concentrated in two hours per week; rescheduling updates to nights restored an extra 8 hours per device per month.
Good battery behavior also reveals underlying device issues, so use run-time drops as an early warning. If multiple units suddenly lose 20% capacity in a month, suspect a firmware bug or charging circuit fault rather than just aging cells. Example: a fleet of 200 units showed the same unexpected drain after an update — fixing the update removed the extra service calls and saved about $12,000 in spare parts that year.
Practical checklist to lower your real TCO:
- Measure baseline run-time for 30 days.
- Compare replacement intervals: current vs. vendor spec.
- Review warranty terms and extend if cheaper than replacements.
- Monitor event-driven drains and reschedule heavy tasks.
- Use run-time trends to trigger inspections before failures.
If you follow those steps, you’ll reduce repair calls, cut spare inventory, and lower unexpected downtime — and you’ll have concrete numbers to show your finance team.
Recommended Products

Battery life: 1 year (approximately)

Resolution (px): 256x192, Field of View (FOV): 56 Degrees x 42 Degrees

[● Komshine EX39 Fiber Fusion Splicer Electrode life around 5000 times(Replaceable); Automatic splicing & automatic heating ]
Pre-Purchase Battery Checks for Measuring Tools
Before you buy a measuring tool, you need to check its battery behavior because real-world use often drains batteries faster than the spec sheet suggests.
Why it matters: batteries that drop voltage under load can make your device reboot during a measurement. Example: a handheld GNSS logger that specs 8 hours but shows voltage dips when it transmits, causing restarts during a 30-minute field survey.
1) Ask the vendor for battery run-down tests and load-curve data.
- What to request: voltage vs. time under a continuous load and during typical duty cycles (for example, 1 minute transmit every 10 minutes).
- Real number to look for: voltage should stay above the device’s minimum operating voltage for your planned run time; aim for at least 20% margin.
Why it matters: current spikes from radios or GPS shorten usable life even if average current looks fine. Example: a cellular-enabled logger that draws 200 mA idle but bursts 1.5 A during retries, draining a 2500 mAh pack much faster than the average suggests.
2) Ask for event-driven current profiles.
- What to request: short-duration current spikes during GPS fixes, network retries, and sensor sampling.
- Real number to look for: identify peak currents and confirm the battery’s discharge curve supports them without dropping below the minimum voltage.
Why it matters: warranty and replacement policy affect your total cost of ownership if batteries fail early. Example: a contractor who bought units with one-year battery coverage paid full price to replace cells in month 14.
3) Confirm warranty verification and replacement terms.
- What to ask: how long battery failures are covered, whether replacements must be done by the vendor, and any required proof (like power-logging files).
- Real number to ask for: get the warranty length in months and the expected turnaround time in business days.
Why it matters: independent tests often show vendors’ claims can be optimistic. Example: you compare the vendor’s run-down curve to your own bench test and see a 25% shorter runtime under your duty cycle.
4) Compare vendor data to independent measurements when possible.
Steps:
- Run your own 1-hour load test with the device doing typical tasks.
- Log voltage and current at 1-second intervals.
- Compare peak currents and end-of-test voltage to the vendor sheet.
Why it matters: detailed power logs let you plan uptime and spare batteries more accurately. Example: with per-second logs you’ll know whether a 12-hour shift needs two spares or three, so you can buy the right number of batteries.
If you can, prefer devices that provide downloadable power logs and clear peak-current specs, and insist on seeing run-down tests for the duty cycle you’ll actually use. These checks reduce surprise costs and give a realistic sense of how long the tool will last in the field.
Recommended Products

The 2.2” high-resolution display is easy to read, even in bright sunlight Get long battery life of up to 168 hours in standard mode and up to 1,800 hours in expedition mode...
Field Tips to Extend Service Life
If you’ve ever watched a battery die halfway through a job, this is why. Shorter battery life means missed readings and more downtime, so you want to change a few habits to get predictable runtime.
Why low power modes matter: they cut idle current so your device lasts longer. For example, a handheld logger I used in a week-long survey lasted three days longer by switching to low power between samples. Steps:
- Set device to low power or “eco” mode in settings.
- Reduce screen brightness to 20–30%.
- Disable nonessential background apps (close or force-stop them).
Result: idle draw drops by 30–60 mA on many units.
Why turning off radios helps: radios keep retrying and burn energy when they don’t have a strong link. I once doubled mission time on a rover by disabling Wi‑Fi and LTE when not uploading photos. Steps:
- Put Wi‑Fi, Bluetooth, and cellular data in airplane mode when you don’t need them.
- Turn radios back on only for scheduled uploads, every 30–60 minutes.
- If your device supports it, use “Wi‑Fi only” transfers over a local network to avoid cellular bursts.
Result: saves hundreds of mAh per day on most field devices.
Why antenna placement matters: poor placement makes the radio transmit harder and longer. On a backpack survey, moving the antenna from inside a jacket to on the shoulder cut retries by half. Steps:
- Mount or hold the antenna where it has a clear line of sight.
- Keep the antenna vertical and free of metal or your body.
- Test signal strength after repositioning; aim for at least -80 dBm.
Result: lower transmit power and fewer retransmissions.
Why batching GPS fixes and uploads helps: each wake-up consumes power, so fewer wake cycles extend runtime. I collected 500 points in a day by batching fixes every 10 minutes and saved a full battery cycle. Steps:
- Set GPS to fix every 5–15 minutes instead of every minute (depending on accuracy needed).
- Aggregate data locally and upload in one batch, e.g., every hour.
- Use motion‑triggered fixes if available (only log when the device moves >5 m).
Result: reduces wake events by up to 90%.
Why temperature control matters: batteries lose capacity in extreme temps and can fail if too hot. On a winter site, keeping packs inside a jacket maintained 80% capacity vs. 50% when exposed. Steps:
- Keep batteries between 0–40°C for Li-ion, ideally 10–30°C.
- Store spare batteries in an insulated pocket close to your body.
- Avoid charging in temperatures below 5°C or above 45°C.
Result: preserves cycle life and immediate runtime.
Why logging runtime and failures matters: data lets you predict when a pack will die and adjust plans. On a project, simple logs revealed a bad batch of batteries that lost 20% capacity. Steps:
- Record start time, end time, and any unexpected resets each session.
- Note temperature and antenna conditions with each run.
- Track failed uploads or retries as counts per hour.
Result: you’ll reduce surprises and pick the right battery reserve.
Quick checklist to use in the field:
- Low power mode on; screen at 20–30%.
- Radios off when idle; schedule uploads.
- Antenna exposed and vertical; target >-80 dBm.
- GPS fixes every 5–15 minutes or motion-triggered.
- Keep batteries at 10–30°C; spare in insulated pocket.
- Log run-times, resets, and retry counts.
Follow these simple steps and you’ll see battery life stretch from hours to days on the same hardware.
Frequently Asked Questions
Can Firmware Updates Significantly Change Device Battery Life?
Like flipping a switch, yes — I can confirm firmware optimization and updated power profiles often cut idle and active draw, so firmware updates can markedly extend or shorten battery life depending on optimizations and real-world usage patterns.
How Does Battery Self-Discharge Affect Long-Term Stored Tools?
I’d warn you that battery self-discharge causes capacity drift and can promote shelf corrosion in stored tools, so I’d recommend periodic checks, removing batteries for long storage, and scheduling maintenance to preserve accuracy and lifespan.
Are Third-Party Batteries Safe for Precision Measuring Instruments?
Yes — but cautiously: I’d warn that third party compatibility can work yet may void warranty implications, risking accuracy, unexpected drain, or damage; I’d test performance, check specs, and prefer certified replacements for precision tools.
Do Duty-Cycle Changes Void Manufacturer Battery-Life Claims?
No — I don’t think duty-cycle myths alone automatically void manufacturer battery-life claims, but I’ll warn you: Warranty implications can arise if you alter duty cycles beyond specified use or show misuse, so document normal operation and follow specs.
How Do Extreme Altitudes Influence Battery Performance?
I once flew a drone whose battery sagged above 10,000 ft; altitude effects mean lower pressure accelerates voltage drop and pressure induced degradation, so I’d expect reduced capacity, higher internal resistance, and shorter runtimes at extreme altitudes.