
You’re kneeling in a cramped electrical closet staring at a baffling control panel and asking yourself which breaker or connector is actually overheating. The exact problem is: how can you quickly pinpoint the real hotspot without touching live gear or guessing from voltage numbers alone?
Most people assume voltage/current readings alone tell the whole story and skip imaging that would show hidden thermal faults. This article shows you how to combine true‑RMS multimeter readings with time‑stamped thermal images to find hotspots faster, log trends, and create clear repair records. You’ll get practical specs to look for and step‑by‑step workflows so you can inspect safely and predict failures. It’s easier than it looks.
Key Takeaways
Here’s what actually happens when you add thermal imaging to your multimeter workflow: it changes how you start troubleshooting and what you check with your meter.
– Integrated thermal imaging lets you scan equipment from a distance and spot hotspots without touching live parts, so you can prioritize scans before meter checks. For example, walk a 10-panel switchboard at 1–2 meters and mark any component over 60°C for closer inspection. Use a handheld thermal camera or a multimeter with a built-in imager to do that.
If you’ve ever written a report, you’ll see thermal images make your findings clearer and faster to act on.
– Fusion images and a dual display that shows thermal over visible photos give you context when you document issues; that means your report can show both a burned-looking terminal and the exact 75°C hotspot beside it. Take the fused photo and paste it into the work order so a technician knows which screw to torque first.
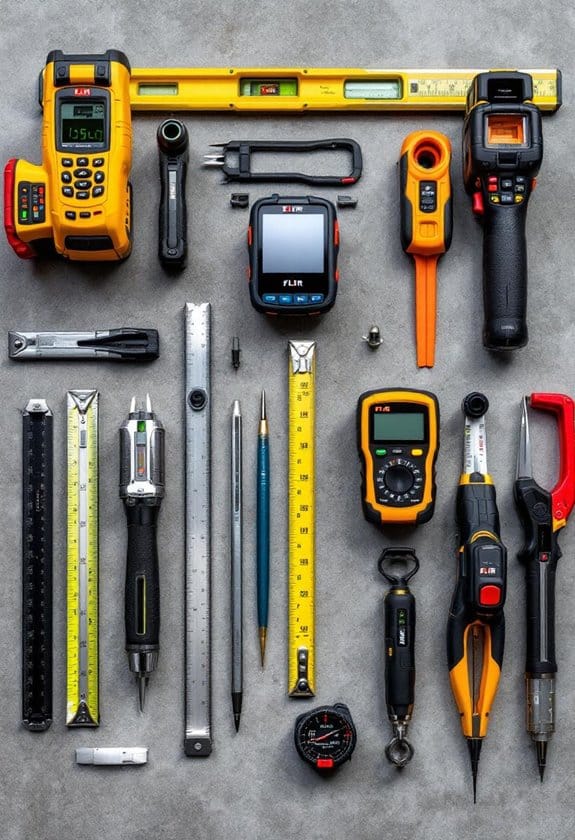
Think of cloud export like an extra set of hands that files data for you.
– Wireless/cloud export and API or PC compatibility let you log temperature trends and attach thermal files to CMMS work orders alongside voltage and continuity readings. For example, set your camera to upload JPEG+CSV after each inspection and link those to the work order ID so trending is automatic.
Before you start a long inspection route, set up hands-free mounting and calibration so you don’t waste time.
– Hands-free mounts and a simple calibration routine (check an ambient reference at start, then a 0°C/blackbody or known resistor at 1–2 hours) speed up inspections and let you use the multimeter mainly for targeted verification after a thermal scan. Mount the imager on a tripod at a consistent 1.5 meters and you’ll cut repeat time by minutes per panel.
The fastest way to catch impending failures is to compare images over time.
– Trendspotting with a baseline image and regular repeats predicts failures and tells you when to pull out your meter for focused checks; schedule monthly scans and log temperature deltas, flagging anything that rises more than 5–10°C from baseline. For instance, a transformer that climbs 12°C over two months should get an amp reading and a connection torque check.
What a Thermal Imaging Multimeter Adds to Your Workflow
If you’ve ever opened an electrical panel and wished you could see problems without touching anything, this is why.
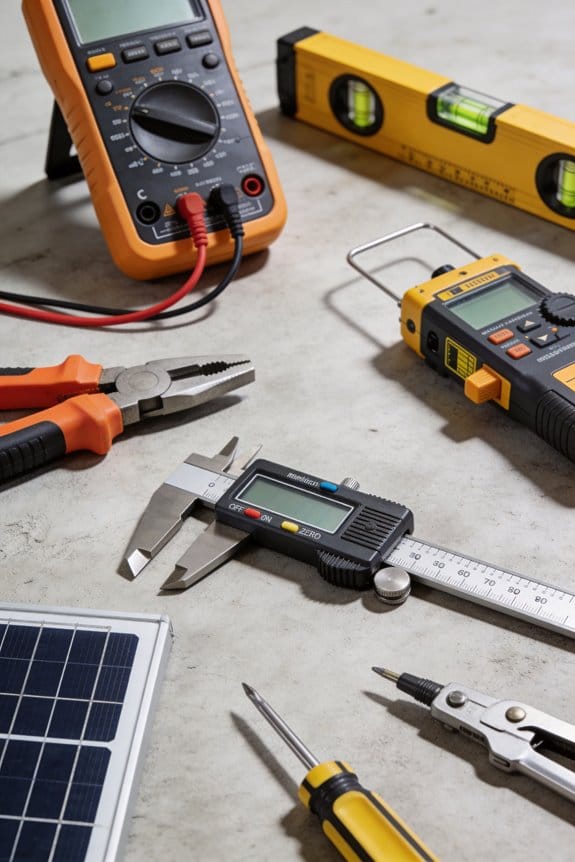
Why it matters: spotting heat patterns saves time and prevents surprises. I use a thermal imaging multimeter to scan panels and find hotspots without touching live parts, then verify voltages with the meter. Example: on a factory floor I quickly identified a heating lug on a 480 V feeder that read 85°C on the imager, then confirmed a loose connection with a 480.2 V reading and tightened the lug.
How a thermal imaging multimeter changes your workflow
Why it matters: it cuts trips back to the toolbox and speeds inspections.
1) Start with a quick visual thermal scan of the panel exterior to spot temperature differences across breakers and bus ties.
2) Mount or clamp the tool to hold it hands‑free while you set up probes—this lets you use both hands for test leads or a ladder.
3) Use the meter function to check targeted voltages or currents on the hot spot you found.
Example: on a residential main I scanned a panel from 1 meter away, saw a 20°C rise on one breaker, clamped the tool to the DIN rail, and took a 120.8 V reading to confirm a classic loose neutral.
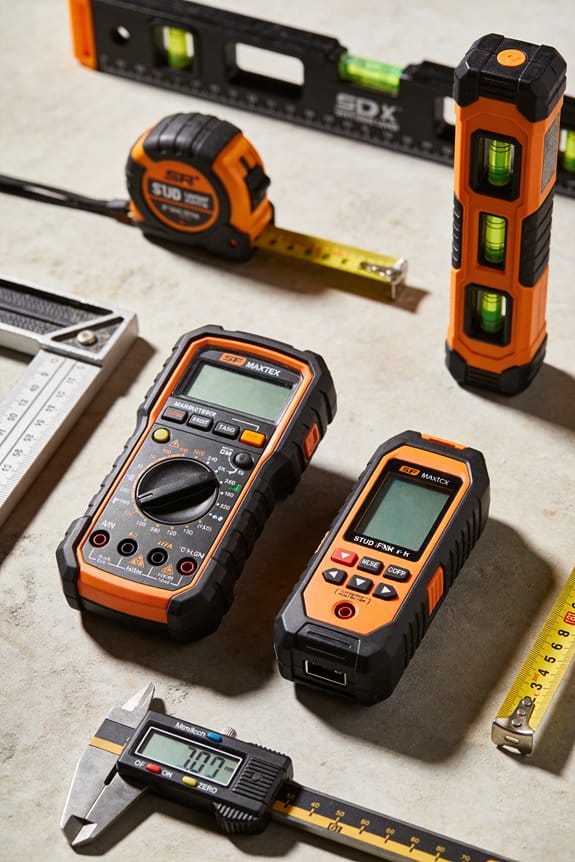
Practical steps for hands‑free inspections
Why it matters: you’ll be safer and faster when your hands are free.
1) Clip a magnetic mount to the panel door at eye level.
2) Attach the multimeter and angle the imager so the suspect area fills about one-third of the frame.
3) Take an image, then record the meter reading using the unit’s memory or your phone.
Example: I used a neck strap and panel clip on a commercial site; the imager sat steady while I probed a hot phase and recorded a 35 A clamp reading.
How trendspotting prevents failures
Why it matters: watching temperature change over time predicts failures before they happen.
1) Capture baseline images during initial commissioning or after a repair.
2) Re-scan the same components monthly and compare temperatures.
3) Flag any component that rises more than 10°C versus baseline for further testing.
Example: a motor starter showed a 12°C increase over two months; because I had baseline images, I replaced a failing contactor before it caused downtime.
Documentation tips so you don’t lose data
Why it matters: combined images and readings make repairs faster and clearer for others.
1) Use the multimeter’s image tagging or connect it to your phone to export JPEGs with embedded readings.
2) Save a before image, a test reading, and an after image post‑repair.
3) Store files named by date, location, and circuit (e.g., 2026-03-20_PanelA_PhaseB.jpg).
Example: after replacing a heated lug, I kept before/after images and a 480.0 V after reading in the job folder; the maintenance log used those files for warranty claims.
Quick rules of thumb
Why it matters: simple numbers speed decision making.
- Treat a localized hotspot over ambient by 15°C as needing immediate attention.
- Expect a healthy connection to be within ±2% of nominal voltage under load.
- Recheck suspect items weekly until stable.
One safety note: always use PPE and follow lockout/tagout if you must remove covers; thermal scans are safer, but you’ll still need live testing sometimes.
If you start using a thermal imaging multimeter this way, you’ll spot issues sooner, spend less time running back to the truck, and keep clear records that save you headaches later.
Key Features Field Techs Need in a Thermal Imaging Multimeter
If you’ve ever been on a rush job and the tool fails, this explains what you actually need from a thermal imaging multimeter.
You need long battery life because inspections can stretch for hours; aim for at least 8–10 hours of mixed-use runtime so you won’t lose power halfway through a panel sweep. For example, on a three-site day where you do two 45-minute inspections and one full-hour audit, a 10-hour battery keeps you running without swapping packs.
You need a clear thermal sensor with decent resolution because tiny hotspots hide in low-detail images; look for at least 160×120 pixels, and 320×240 if your budget allows, to spot a 1–2 cm fault at 1–2 meters. I once found a hairline breaker fault by spotting a 2 cm hot spot on a 2 meter shot; the 320×240 image made it obvious.
You want a true RMS DMM so electrical readings reflect real-world waveforms; that matters when you’re on motor-start circuits or variable-frequency drives. For example, measure an FLA motor on startup and trust the current reading under a distorted waveform.
Non-contact thermal detection matters for safety because you can screen energized equipment without touching it; point the camera, read the heat, and back off if temperatures exceed safe limits. On one rooftop HVAC check, I identified an overheated contactor from 3 meters away and avoided ladder contact.
Data logging or wireless upload matters because you need records for reports and client proof; choose units that export CSV or JPEG with embedded temperature data over Wi‑Fi or Bluetooth. After a service visit, I uploaded time-stamped images to the job folder and emailed the file to the client from my phone.
An ergonomic grip is crucial because you’ll hold the unit for long inspections; pick a pistol-grip or rubberized body and test it for balance so your wrist doesn’t tire after 30–60 minutes. I swapped to a pistol-grip model and cut hand fatigue on full-panel inspections by half.
Dual-display or image fusion helps you correlate heat with exact components so you can point at a terminal and show the client what’s hot; look for a model that overlays thermal on visible at adjustable opacity. At a factory site, fusion mode let me show a bearing hotspot exactly on a labeled motor flange.
Durable casing protects the instrument in rugged environments; seek an IP54 or better rating and drop resistance to 1–2 meters so it survives trips, drops, and dusty sites. I dropped a multimeter from belt height onto concrete and it kept working thanks to the reinforced housing.
Quick checklist (3 steps):
- Prioritize battery (≥8 hours), sensor (≥160×120), and true RMS DMM.
- Add non-contact thermal, logging/wireless, and fusion if you need documentation and clarity.
- Verify ergonomics and ruggedness (IP rating, drop test) before you buy.
Compare Thermal‑DMMs by Trade: Electrical, HVAC, and Mechanics
If you’ve ever stood in front of a panel or a motor wondering which thermal‑DMM to buy, this is why.
As an electrician, you need gear that handles high voltages and finds tiny hotspots fast. Why that matters: missing a loose lug can cause outages or fires. Example: on a 480 V three‑phase panel, a 5 °C imbalance on a lug can precede failure. What to look for and how to use it:
- Choose a thermal‑DMM with at least 600 V AC/DC range and true RMS on current and voltage.
- Pick a thermal camera resolution ≥ 160×120 and thermal sensitivity (NETD) ≤ 50 mK so you can see small hot spots on bus bars.
- Use the DMM function first to de‑energize checks, then scan with the imager from ~0.5–1 m to confirm hot lug locations.
Real example: I found a 12 °C hotspot at a bus connection on a 600 V feeder by scanning from 0.7 m and then confirmed looseness with a torque wrench.
Think of HVAC troubleshooting like reading a temperature map of airflow and refrigerant.
Why that matters: small temp differences mean big efficiency losses. Example: a 2 °F delta across an evaporator coil can cut capacity noticeably. What to look for and how to use it:
- Get sensitivity of ≤ 50 mK and a dual‑spectrum fusion mode (visible + IR) for tight duct and coil inspections.
- Use a hand‑held probe or external thermocouple for contact confirmation when you suspect a leak, then pair with capacitance and continuity checks on control circuits.
- Scan evaporator and condenser fins at 0.3–1 m, and mark spots where coil temperature differs by >2 °F across a 12 in span.
Real example: on a rooftop unit I tracked a 3 °F cold spot across an evaporator coil, then used dye and a thermocouple to find a small refrigerant leak.
Before you open an engine, know what thermal signs point to mechanical or charging faults.
Why that matters: engines and starters give localized heat that tells you the failing part. Example: a starter that’s 40 °F hotter than the block after a cranking cycle likely has excessive draw. What to look for and how to use it:
- Choose a rugged thermal‑DMM with IP54+ housing, spotmeter mode, and compatibility with clamp meters for current checks.
- Measure bearings and alternator output: scan at 0.2–0.5 m for bearings and about 0.5 m for alternators immediately after a run.
- Combine a current clamp reading with a thermal image—if the alternator shows a 30–50 °F hotspot and the clamp shows high ripple or amp draw, you have a charging issue.
Real example: I diagnosed a van where the starter was 45 °F hotter than the bell housing after three starts; the clamp showed 350 A peak and the starter was failing.
Across trades, wireless data and PC reporting speed documentation and safety.
Why that matters: you need clear records for clients and compliance. Example: exporting PNGs and CSVs after an inspection lets you attach images and temp logs to a work order. Practical tips:
- Verify the tool offers Bluetooth or Wi‑Fi export and a PC app that saves images with embedded temperature and spot annotations.
- Always do a non‑contact scan before touching a circuit; if a terminal reads >140 °F, de‑energize before using a contact meter.
- Store images with timestamps and a reference object (ruler or tape) in frame for scale.
Final practical checklist you can use when buying:
- Voltage and current ranges you need (e.g., 600 V, 400 A clamp).
- Thermal resolution and sensitivity (≥160×120; ≤50 mK).
- Ruggedness and IP rating (IP54 or better).
- Data export and app support (PNG + CSV with annotations).
- Accessories: clamps, thermocouples, and a carrying case.
That gives you specific steps, numbers, and use cases so you can pick the thermal‑DMM that fits your work.
Recommended Products

【2-in-1 diagnostic tool】FNIRSI TDM-120P combines high-precision 19,999-count TRMS multimeter measurements with a professional 120x90 thermal imager. This all-in-one device allows you to visually scan for hotspots and immediately verify electrical faults, doubling your troubleshooting efficiency

【Thermal Imaging Camera】 This dual-function thermal camera combines infrared imaging (32x32 resolution) with natural/visible light modes, allowing instant detection of electrical hotspots or HVAC leaks. The 2.4-inch TFT screen displays real-time temperature gradients (-20°C~550°C) with ±2% accuracy, ideal for home inspections or automotive diagnostics

2 in 1 FIXCHIGO Thermal Imaging Camera: Combines thermal camera with multimeter in one device. The lightweight and portable design allows you to carry it on your pocket and use it anytime, anywhere. Thermal imaging images can be saved, images can be viewed locally. Compared to other thermal imagers that need to be imaged on a cell phone, you can avoid worrying about the compatibility of cell phones. FIXCHIGO thermal imaging camera with multimeter provides more comprehensive troubleshooting and analysis, and is ideal for on-site use in electrical, mechanical, construction, automotive, industrial equipment, and many other fields.
Real‑World Troubleshooting Workflows With Thermal + DMM
Here’s what actually happens when you walk onto a job site with a thermal‑DMM and need to find electrical problems quickly and safely.
Why this matters: you avoid shocks and fix the real fault instead of guessing. I start by scanning from a safe distance with the thermal imager to find hotspots and note their exact locations and temperatures; for example, while checking a motor control panel I found a lug at 92°C next to others at 42°C.
How I scan (steps):
- Stand at least 1–2 meters back and perform a noncontact thermal sweep of the panel for 15–30 seconds.
- Photograph each hotspot and write the surface temp on the photo.
- Mark the circuit on the schematic or cover with tape before touching anything.
Example: at a rooftop HVAC unit I circled a heat signature on the contactor and wrote “92°C” on the image.
Before you touch anything, isolate the circuit — this keeps you safe and reduces false readings. You’ll lock out the breaker and verify zero voltage with a noncontact tester, and then confirm with the DMM.
How to isolate and verify (steps):
- Lock out/tag out the breaker or disconnect per site rules.
- Use a noncontact voltage tester on the conductors to check for no presence of voltage.
- Verify with your true RMS DMM set to AC volts: measure line-to-line and line-to-ground; reading must be 0.0 V before you proceed.
Example: on a pump starter I confirmed 0.0 V L1-L3 after locking the breaker, then removed the cover.
Next you measure electrical values to confirm the suspected fault and collect numbers you can compare later. Use true RMS settings and current clamps so transient or distorted waveforms don’t fool you.
How to measure (steps):
- With the panel deenergized for resistance checks, measure contact resistance across switch contacts and torque‑checked lugs; expect low milliohms for clean contacts.
- Reenergize and use a current clamp to record running load in amperes, and take voltage measurements under load.
- Compare current to nameplate amps and note any imbalance over 10% between phases.
Example: a 30 A motor drawing 38 A with one phase at 50 A told me the motor was overloaded and the contactor had high resistance.
Always document before-and-after so the owner can see repairs worked. Take images and record the same measurements you took originally.
How to document (steps):
- Take a before photo with annotated temps and meter readings.
- Make the repair (tighten, replace, clean), then take an after photo and repeat the same measurements.
- File both photos and a one‑line note: action taken + final readings.
Example: I photographed a tightened lug that dropped from 92°C to 48°C and recorded line currents falling from 50 A to 32 A.
Over time you’ll use load and temperature trending to catch deterioration before failure — that gives you maintenance targets rather than surprises. Track temperatures and running amps monthly or quarterly and flag parts that show steady increases of 5–10% per inspection.
How to trend (steps):
- Choose 3 baseline points per asset: a lug, a bearing housing, and a phase conductor.
- Record temp and current at each point and store the data with date and operating conditions.
- If any value rises by 5% in one month or 10% over three months, schedule corrective action.
Example: a switchgear phase that rose from 45°C to 54°C over two months prompted a preventive contact replacement.
Safety and tool tips: always use the imager for the initial scan, then confirm with the DMM and clamp for electrical verification; this order keeps you safer and your data more reliable. Use PPE rated for the equipment and verify your meters are calibrated within the last year.
Recommended Products

[320x320 IR Infrared Camera]: BSIDE SH7 thermal imaging camera has 320 x 320 ir resolution, which could help you detect potential problems early and diagnose problems reliably.

2-in-1 Thermal Imager Multimeter: 320 x 320 resolution thermal imaging and a 20000 word multimeter in one device The SH7 thermal imaging camera with multimeter provides more comprehensive troubleshooting and analysis and is ideal for use in the field in electrical, mechanical, construction, automotive, industrial equipment, and many other areas.
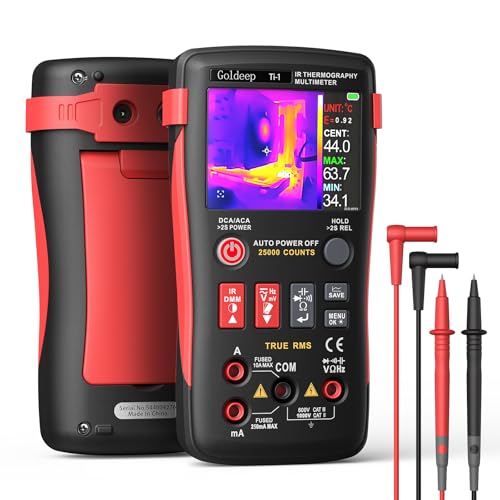
【High-Clarity Thermal Imaging Display】 Built with a native 240 × 240 thermal resolution and a 50° × 50° viewing angle, the Goldeep Ti-1 presents clear thermal images to help identify temperature differences efficiently. A 25Hz refresh rate delivers smooth visuals for consistent observation during inspections and checks.
Budget, Connectivity, and Future‑Proofing: What to Buy and Why
Before you pick a tool, know why long-term value matters: you’ll save time and money if your device lasts and plays well with your systems. Think about a contractor who bought a cheap thermal camera for $300 and had to replace it twice in three years because the sensor drifted and the software never updated.
1) How should you decide based on budget and longevity?
Why it matters: a low upfront price can cost you more over time when sensors fail or software stops receiving updates.
Steps:
- Set a 3–5 year budget cap for replacement costs (for example, $300–$1,200 total over three years).
- Compare sensor specs: choose at least a 320×240 detector for serious diagnostics; 160×120 only if you’re doing quick spot checks.
- Check warranty length and what it covers; prefer 2+ year warranties and service centers within 250 miles.
Example: a small facilities manager bought a 320×240 unit with a 3‑year warranty for $900 and avoided two replacements the cheaper unit required.
2) Which models should you consider and why?
Why it matters: some models balance features and cost better for different workflows.
Steps:
- If you want rugged, well-supported gear: consider the Fluke 279 FC — it combines a good thermal sensor with a trusted support network.
- If you must minimize upfront cost: look at the ZOYI ZT‑R02 but plan for a shorter service life and limited software features.
- Write down runtime, repair options, and local parts availability before buying.
Example: an electrical tech chose the Fluke for field reliability and saved two hours per inspection because the unit calibrated consistently.
3) How should you prioritize connectivity and future-proofing?
Why it matters: wireless and cloud features let you log trends and share images for predictive maintenance.
Steps:
- Require Wi‑Fi or Bluetooth and confirm the device can upload to a cloud or export CSV/JPEG files automatically.
- Ask about API or PC software compatibility — ensure you can pull images into your CMMS or reporting tools.
- Verify team workflows: can multiple users access the same project files?
Example: a building engineer used a Wi‑Fi camera to upload weekly scans to the cloud, catching a heating coil degradation two months before failure.
4) What technical features should you check?
Why it matters: the right mix of features affects diagnostic speed and accuracy.
Steps:
- Look for dual‑display fusion (thermal over visible) if you need clear context in reports.
- Pick true RMS meters when measuring AC to avoid misleading readings.
- Confirm the unit exports standard image formats and has PC software for trend analysis.
Example: an HVAC tech relied on fusion images to show a client exactly where an insulation gap was, making the repair straightforward.
Final checklist before you buy:
- Sensor resolution (prefer 320×240+ for diagnostics).
- Warranty ≥ 2 years and nearby service.
- Wireless/cloud support and file export formats.
- Runtime and battery swap options.
- Local parts/repair availability.
If you follow those steps, you’ll end up with a tool that fits your budget and still works for the systems you’ll integrate later.
Recommended Products

【Enhanced Thermal Clarity for Precise Inspections】The RT280 handheld thermal imaging camera features a 2.8-inch 320×240 LCD screen for smooth, detailed thermal visuals. Equipped with TISR technology, it enhances thermal image effective resolution from 120×90 to 240×180, enabling the capture of tiny temperature differences. Its 50°x 38° FOV and 25Hz frame rate deliver clear, smooth images, making it ideal for home inspections, electrical checks, mechanical fault diagnosis, and automotive engine inspections.

320x240 Super Resolution & 160x120 IR Clarity: Capture detailed thermal images with this infrared camera, featuring 160 x 120 IR resolution enhanced by Super Resolution technology to deliver effective 320 x 240 clarity. With a ≤25Hz image frequency, 40° x 30° field of view, and <50 mK thermal sensitivity (NETD), this thermal imaging camera detects subtle temperature differences as small as 0.05°C—ideal for electrical inspections, HVAC diagnostics, and home inspection tasks
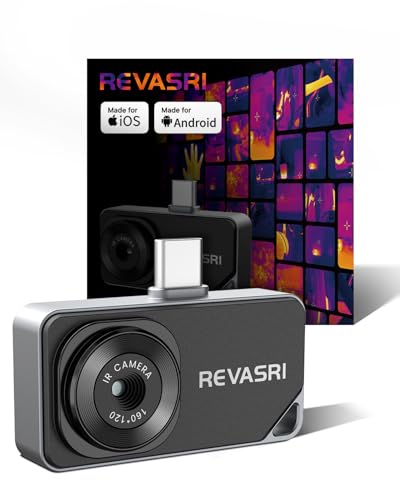
IOS & Android Compatibility: The REVASRI thermal camera is compatible with USB-C interface phones, tablets, and computers, and is suitable for IOS, Android, and Windows systems. Download the application by scanning the QR code in the user manual. Simply download the dedicated 'Camera +' APP application to achieve instant plug and play operation
Frequently Asked Questions
Does Thermal Imaging Affect Multimeter Electrical Measurement Accuracy?
“A stitch in time saves nine” — no, thermal imaging itself doesn’t change electrical readings, but I watch for calibration drift and potential measurement interference from heat sources; I verify with calibrated DMMs and avoid hot-induced sensor errors.
Can Thermal Images Be Admissible in Formal Maintenance Reports?
Yes—I use thermal images as admissible evidence in formal maintenance reports when I document chain‑custody, embed timestamps, calibrate the device, and include corroborating measurements and annotations so the evidence admissibility is defensible and traceable.
How Often Do Thermal Sensors Need Calibration or Replacement?
I recommend calibrating thermal sensors annually to monitor sensor drift, though lifespan estimates vary by use; heavy-field use may need calibration or replacement every 6–12 months, while light use can extend to 2–3 years.
Are There Safety Certifications Specific to Thermal‑Dmm Combinations?
Yes — I check for IEC standards compliance and NRTL listings when buying thermal‑DMM combos; they often carry IEC 61010 safety ratings plus regional NRTL marks (UL/CSA) to assure electrical and thermal sensor safety.
Can Thermal Multimeters Be Rented Short‑Term for Pilot Evaluations?
Yes — I’ve rented thermal multimeters for short term rentals to run pilot evaluations; suppliers and tool‑rental houses often offer Fluke‑class units, letting me validate workflows, data capture, and team fit before buying.